The AUDJPY pair is in a precarious position following the release of Australia’s Monthly Consumer Price Index, as it failed to meet expectations.
…
This is a premium post.
[s2If !current_user_can(access_s2member_level4)]Please register for FREE REGISTER to read full post below containing analysis. In case of any error or you think you are not able to read the full post below, please email us at support#nehcap.com [lwa][/s2If] [s2If current_user_can(access_s2member_level1)]
- AUD/JPY stands on slippery grounds after Australia Monthly Consumer Price Index disappoints.
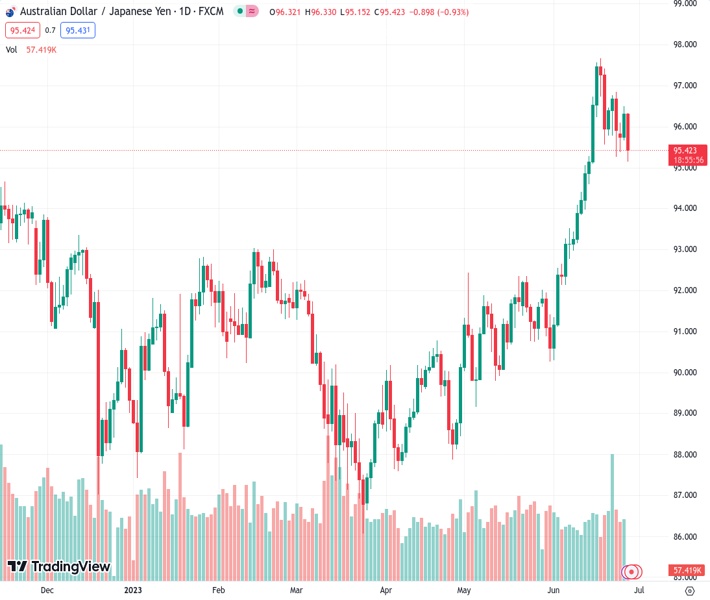
The pair currently trades last at 95.4200.
The previous day high was 96.5 while the previous day low was 95.66. The daily 38.2% Fib levels comes at 96.18, expected to provide resistance. Similarly, the daily 61.8% fib level is at 95.98, expected to provide resistance.
AUD/JPY nosedives 60 pips as it justifies downbeat Australia data to recall bears amid early Wednesday, down 1.0% near 95.30 by the press time. Apart from Australia inflation, the risk-negative headlines surrounding China and a pullback in the yields also weigh on the cross-currency pair.
Australia’s Monthly Consumer Price Index (CPI) for May drops to 5.6% YoY versus 6.1% expected and 6.8% prior. The same amplifies concerns about the Reserve Bank of Australia’s (RBA) pause in the rate hikes after two consecutive hawkish surprises, which in turn drowns the Australian Dollar (AUD).
Also read: Breaking: Australian CPI rises 5.6% YoY in May vs. 6.1% expected
Additionally, the fresh fears surrounding the US-China tension and cautious mood ahead of the top-tier central bankers’ speeches the at ECB forum, as well as expectations of the Bank of Japan’s (BoJ) market intervention also weigh on the AUD/JPY pair.
US President Joe Biden said late Tuesday that China has enormous problems. His comments were joined by the Wall Street Journal (WSJ) news saying, “The Biden administration is considering new restrictions on exports of artificial intelligence chips to China, as concerns rise over the power of the technology in the hands of US rivals, according to people familiar with the situation.”
It should be noted that the improvement in China Industrial Profits for May, -12.6% YoY versus -18.2% prior, appeared to have a put a floor under the AUD/JPY price after the Aussie inflation data.
Amid these plays, S&P500 Futures print mild losses despite the upbeat performance of Wall Street whereas the US Treasury bond yields grind lower.
Having witnessed the initial market reaction to the Aussie inflation numbers, AUD/JPY pair traders may concentrate on the risk catalysts for clear directions. Also important will be Bank of Japan (BoJ) Governor Kazuo Ueda’s speech at the European Central Bank (ECB) Forum in Sintra.
AUD/JPY pair’s U-turn from a one-week-old descending resistance line and the 10-DMA, respectively near 96.25 and 96.40, directs the bears toward the previous weekly low of around 95.25.
Technical Levels: Supports and Resistances
AUDJPY currently trading at 95.9 at the time of writing. Pair opened at 96.33 and is trading with a change of -0.45% % .
| Overview | Overview.1 | |
|---|---|---|
| 0 | Today last price | 95.9 |
| 1 | Today Daily Change | -0.43 |
| 2 | Today Daily Change % | -0.45% |
| 3 | Today daily open | 96.33 |
The pair remains strongly bullish on the daily timeframe. It trades above its 20 SMA @ 94.66, 50 SMA 92.3, 100 SMA @ 91.16 and 200 SMA @ 91.74.
| Trends | Trends.1 | |
|---|---|---|
| 0 | Daily SMA20 | 94.66 |
| 1 | Daily SMA50 | 92.30 |
| 2 | Daily SMA100 | 91.16 |
| 3 | Daily SMA200 | 91.74 |
The previous day high was 96.5 while the previous day low was 95.66. The daily 38.2% Fib levels comes at 96.18, expected to provide resistance. Similarly, the daily 61.8% fib level is at 95.98, expected to provide resistance.
Note the levels of interest below:
- Pivot support is noted at 95.83, 95.33, 95.0
- Pivot resistance is noted at 96.67, 97.0, 97.5
| Levels | Levels.1 |
|---|---|
| Previous Daily High | 96.50 |
| Previous Daily Low | 95.66 |
| Previous Weekly High | 97.68 |
| Previous Weekly Low | 95.26 |
| Previous Monthly High | 92.44 |
| Previous Monthly Low | 89.16 |
| Daily Fibonacci 38.2% | 96.18 |
| Daily Fibonacci 61.8% | 95.98 |
| Daily Pivot Point S1 | 95.83 |
| Daily Pivot Point S2 | 95.33 |
| Daily Pivot Point S3 | 95.00 |
| Daily Pivot Point R1 | 96.67 |
| Daily Pivot Point R2 | 97.00 |
| Daily Pivot Point R3 | 97.50 |
[/s2If]
Nehcap Expert Advisor
The NEHCAP MT4 EA is high quality professional trading system geared to generate returns without using GRID or martingales. Each trade has strict risk per trade parameter. The pairs under management include EURUSD, GBPUSD, AUDCAD, AUDNZD,GBPAUD, EURAUD, EURCAD, CHFJPY and many more.
The system is trading live: LIVE ACCOUNT TRACKING
You can run it free. Apply for a free trial and track our account. Buy the system or use profit share mechanism to generate returns on your MT4.
Join Our Telegram Group
")


