#XAUUSD @ 1,928.22 Gold price is anticipating a range expansion amid a further decline in the US Dollar Index.
…
This is a premium post.
[s2If !current_user_can(access_s2member_level4)]Please register for FREE REGISTER to read full post below containing analysis. In case of any error or you think you are not able to read the full post below, please email us at support#nehcap.com [lwa][/s2If] [s2If current_user_can(access_s2member_level1)]
- Gold price is anticipating a range expansion amid a further decline in the US Dollar Index.
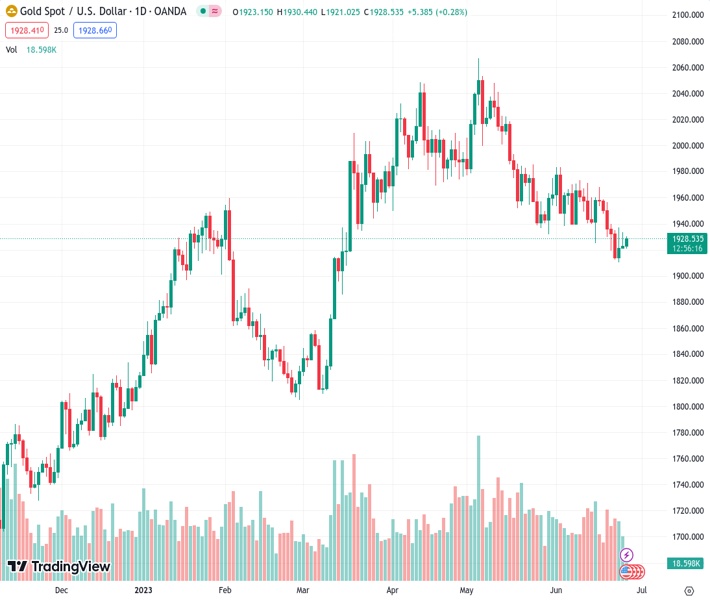
The pair currently trades last at 1928.22.
The previous day high was 1933.39 while the previous day low was 1920.8. The daily 38.2% Fib levels comes at 1928.58, expected to provide resistance. Similarly, the daily 61.8% fib level is at 1925.61, expected to provide support.
Gold price (XAU/USD) is demonstrating signs of volatility contraction below $1,930.00 in the European session. The precious metal is looking to deliver gains as the US Dollar Index (DXY) has come under pressure due to the risk-appetite theme.
S&P500 futures have posted decent gains in London as investors are shrugging-off uncertainty associated with the upcoming quarterly result season. The USD Index has refreshed its day’s low at 102.49 amid positive market sentiment. Meanwhile, upbeat US Yields have been restricting the upside in the Gold price. The 10-year US Treasury yields have jumped to near 3.74%.
Mixed responses from Federal Reserve (Fed) policymakers have kept investors on their toes. Atlanta Fed Bank President Raphael Bostic favored the continuation of a steady policy as further restrictions could damage the strength of the economy. On the contrary, San Francisco Fed Bank President Mary Daly suggested that two more rate hikes this year are a “very reasonable” projection, supporting similar commentary from Fed chair Jerome Powell.
For further actions, the United States Durable Goods Orders data will be in focus. As per the consensus, the economic data is seen contracting by 1.0% vs. an expansion of 1.1%. Durable Goods Orders excluding defense are seen as stagnant against a contraction of 0.7%.
Gold price is auctioning in a Symmetrical Triangle chart pattern on an hourly scale, which indicates a decline in volatility but is followed by an explosion in the same. Horizontal support is plotted from the previous week’s low at $1,910.18.
A straight 50-period Exponential Moving Average (EMA) at $1,926.00 portrays a non-directional performance.
The Relative Strength Index (RSI) (14) is oscillating in the 40.00-60.00 range, which indicates that investors await a potential trigger.
Technical Levels: Supports and Resistances
XAUUSD currently trading at 1928.35 at the time of writing. Pair opened at 1923.31 and is trading with a change of 0.26 % .
| Overview | Overview.1 | |
|---|---|---|
| 0 | Today last price | 1928.35 |
| 1 | Today Daily Change | 5.04 |
| 2 | Today Daily Change % | 0.26 |
| 3 | Today daily open | 1923.31 |
The pair is trading below its 20 Daily moving average @ 1948.84, below its 50 Daily moving average @ 1975.88 , below its 100 Daily moving average @ 1942.76 and above its 200 Daily moving average @ 1854.61
| Trends | Trends.1 | |
|---|---|---|
| 0 | Daily SMA20 | 1948.84 |
| 1 | Daily SMA50 | 1975.88 |
| 2 | Daily SMA100 | 1942.76 |
| 3 | Daily SMA200 | 1854.61 |
The previous day high was 1933.39 while the previous day low was 1920.8. The daily 38.2% Fib levels comes at 1928.58, expected to provide resistance. Similarly, the daily 61.8% fib level is at 1925.61, expected to provide support.
Note the levels of interest below:
- Pivot support is noted at 1918.28, 1913.24, 1905.69
- Pivot resistance is noted at 1930.87, 1938.42, 1943.46
| Levels | Levels.1 |
|---|---|
| Previous Daily High | 1933.39 |
| Previous Daily Low | 1920.80 |
| Previous Weekly High | 1958.85 |
| Previous Weekly Low | 1910.18 |
| Previous Monthly High | 2079.76 |
| Previous Monthly Low | 1932.12 |
| Daily Fibonacci 38.2% | 1928.58 |
| Daily Fibonacci 61.8% | 1925.61 |
| Daily Pivot Point S1 | 1918.28 |
| Daily Pivot Point S2 | 1913.24 |
| Daily Pivot Point S3 | 1905.69 |
| Daily Pivot Point R1 | 1930.87 |
| Daily Pivot Point R2 | 1938.42 |
| Daily Pivot Point R3 | 1943.46 |
[/s2If]
Nehcap Expert Advisor
The NEHCAP MT4 EA is high quality professional trading system geared to generate returns without using GRID or martingales. Each trade has strict risk per trade parameter. The pairs under management include EURUSD, GBPUSD, AUDCAD, AUDNZD,GBPAUD, EURAUD, EURCAD, CHFJPY and many more.
The system is trading live: LIVE ACCOUNT TRACKING
You can run it free. Apply for a free trial and track our account. Buy the system or use profit share mechanism to generate returns on your MT4.
Join Our Telegram Group
")


