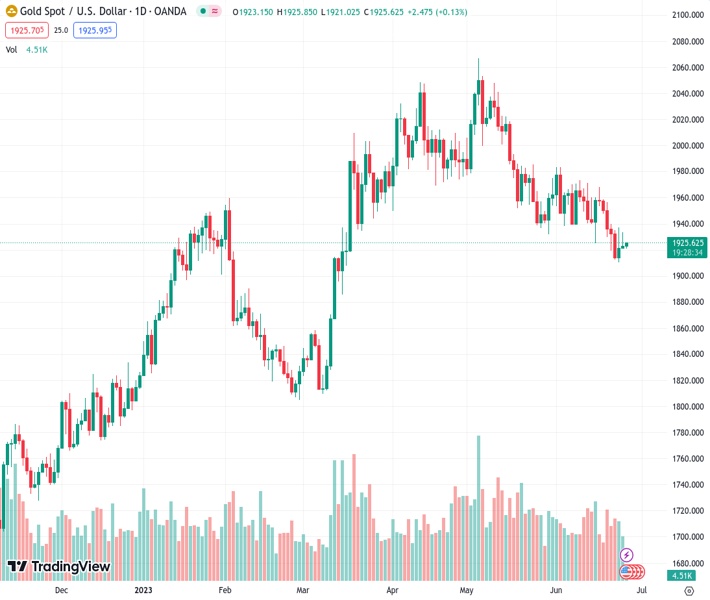
#XAUUSD @ 1925.00 Gold price remains confined in a narrow range just above the multi-month low set last week.
…
This is a premium post.
[s2If !current_user_can(access_s2member_level4)]Please register for FREE REGISTER to read full post below containing analysis. In case of any error or you think you are not able to read the full post below, please email us at support#nehcap.com [lwa][/s2If] [s2If current_user_can(access_s2member_level1)]
- Gold price remains confined in a narrow range just above the multi-month low set last week.
The pair currently trades last at 1925.00.
The previous day high was 1933.39 while the previous day low was 1920.8. The daily 38.2% Fib levels comes at 1928.58, expected to provide resistance. Similarly, the daily 61.8% fib level is at 1925.61, expected to provide resistance.
Gold price struggles to gain any meaningful traction on Tuesday and oscillates in a narrow trading band, just above the $1,920 level through the Asian session. The XAU/USD, meanwhile, remains well within the striking distance of over a three-month low touched last Friday and seems vulnerable to below the 100-day Simple Moving Average (SMA).
The initial market reaction to the aborted mutiny by armed mercenaries in Russia over the weekend turns out to be short-lived in the wake of the hawkish stance adopted by major central banks, which continues to cap the non-yielding Gold price. It is worth recalling that the Reserve Bank of Australia (RBA) and the Bank of Canada (BoC) delivered a surprise 25 basis points (bps) rate hike earlier this month, while the European Central Bank (ECB) last week lifted rates to the highest level in 22 years. Moreover, the Bank of England (BoE), the Swiss National Bank (SNB) and Norges Bank hiked their benchmark interest rates last Thursday.
The Federal Reserve (Fed) has also signalled that borrowing costs may still need to rise as much as 50 bps by the end of this year. Adding to this, Fed Chair Jerome Powell, during his two-day congressional testimony last week, said that the US central bank doesn’t see rate cuts happening any time soon and will wait until it is confident that inflation is moving down to the 2% target. Hence, the focus will remain glued to the release of the United States (US) Personal Consumption Expenditures (PCE) Price Index, or the Fed’s preferred inflation gauge on Friday, which might influence expectations about the next policy move.
Investors this week will further take cues from speeches by ECB President Christine Lagarde, BoE Governor Andrew Bailey, Fed Chair Jerome Powell and Bank of Japan (BoJ) Governor Kazuo Ueda at a panel discussion in Sintra on Wednesday. In the meantime, Tuesday’s US economic docket – featuring Durable Goods Orders, the Conference Board’s Consumer Confidence Index, New Home Sales and Richmond Manufacturing Index – will be looked upon for some impetus around Gold price. The downside, meanwhile, seems limited in the wake of looming recession risks, which tend to benefit the safe-haven XAU/USD.
Market participants seem worried about economic headwinds stemming from rapidly rising borrowing costs. The fears were further fueled by the fact that S&P Global on Sunday said that it has cut its 2023 growth forecast for China to 5.2% from 5.5%. The rating agency expects a recovery in Asia’s largest economy to continue, albeit at an “uneven” pace. This, in turn, might hold back traders from placing aggressive bearish bets around the Gold price, at least for the time being. Nevertheless, the lack of any meaningful buying suggests that the recent downtrend might still be far from being over and favours bearish traders.
From a technical perspective, nothing seems to have changed much for the Gold price and the near-term bias still seems tilted in favour of bearish traders. That said, it will still be prudent to wait for some follow-through selling below the multi-month low, around the $1,910 area touched on Friday, before positioning for any further losses. The XAU/USD might then slide below the $1,900 round-figure mark, towards testing the very important 200-day SMA around the $1,840 region, with some intermediate support near the $1,876-$1,875 zone.
On the flip side, any meaningful recovery is more likely to attract fresh sellers and remain capped near the 100-day SMA support breakpoint, currently pegged around the $1,942-$1,943 region. This should now act as a pivotal point, which if cleared decisively might trigger a short-covering rally. The Gold price might then accelerate the momentum towards the $1,962-$1,964 region. This is closely followed by the $1,970-$1,972 resistance zone and the $1,983-$1,985 hurdle, above which the XAU/USD might aim to surpass the $2,000 psychological mark and climb to the $2,010-$2,012 barrier.
Technical Levels: Supports and Resistances
XAUUSD currently trading at 1924.44 at the time of writing. Pair opened at 1923.31 and is trading with a change of 0.06 % .
| Overview | Overview.1 | |
|---|---|---|
| 0 | Today last price | 1924.44 |
| 1 | Today Daily Change | 1.13 |
| 2 | Today Daily Change % | 0.06 |
| 3 | Today daily open | 1923.31 |
The pair is trading below its 20 Daily moving average @ 1948.84, below its 50 Daily moving average @ 1975.88 , below its 100 Daily moving average @ 1942.76 and above its 200 Daily moving average @ 1854.61
| Trends | Trends.1 | |
|---|---|---|
| 0 | Daily SMA20 | 1948.84 |
| 1 | Daily SMA50 | 1975.88 |
| 2 | Daily SMA100 | 1942.76 |
| 3 | Daily SMA200 | 1854.61 |
The previous day high was 1933.39 while the previous day low was 1920.8. The daily 38.2% Fib levels comes at 1928.58, expected to provide resistance. Similarly, the daily 61.8% fib level is at 1925.61, expected to provide resistance.
Note the levels of interest below:
- Pivot support is noted at 1918.28, 1913.24, 1905.69
- Pivot resistance is noted at 1930.87, 1938.42, 1943.46
| Levels | Levels.1 |
|---|---|
| Previous Daily High | 1933.39 |
| Previous Daily Low | 1920.80 |
| Previous Weekly High | 1958.85 |
| Previous Weekly Low | 1910.18 |
| Previous Monthly High | 2079.76 |
| Previous Monthly Low | 1932.12 |
| Daily Fibonacci 38.2% | 1928.58 |
| Daily Fibonacci 61.8% | 1925.61 |
| Daily Pivot Point S1 | 1918.28 |
| Daily Pivot Point S2 | 1913.24 |
| Daily Pivot Point S3 | 1905.69 |
| Daily Pivot Point R1 | 1930.87 |
| Daily Pivot Point R2 | 1938.42 |
| Daily Pivot Point R3 | 1943.46 |
[/s2If]
Nehcap Expert Advisor
The NEHCAP MT4 EA is high quality professional trading system geared to generate returns without using GRID or martingales. Each trade has strict risk per trade parameter. The pairs under management include EURUSD, GBPUSD, AUDCAD, AUDNZD,GBPAUD, EURAUD, EURCAD, CHFJPY and many more.
The system is trading live: LIVE ACCOUNT TRACKING
You can run it free. Apply for a free trial and track our account. Buy the system or use profit share mechanism to generate returns on your MT4.
Join Our Telegram Group
")


