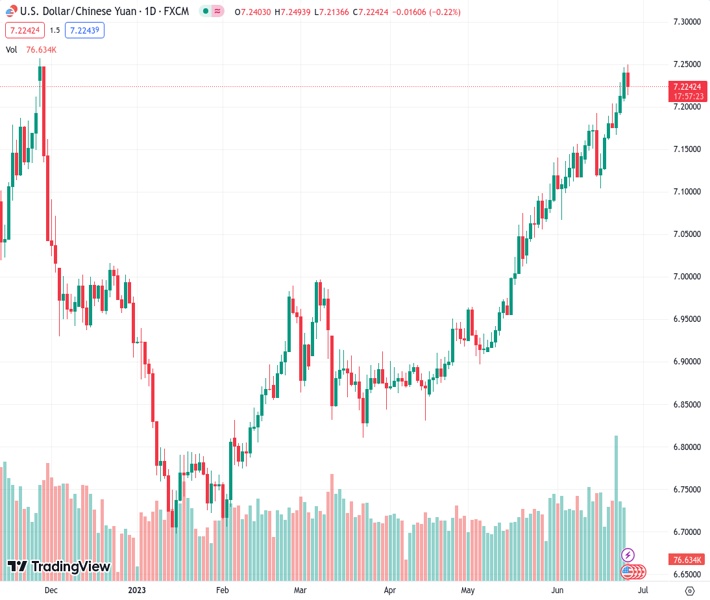
USDCNH retreats from the seven-month peak and experiences its initial decline in four days.
…
This is a premium post.
[s2If !current_user_can(access_s2member_level4)]Please register for FREE REGISTER to read full post below containing analysis. In case of any error or you think you are not able to read the full post below, please email us at support#nehcap.com [lwa][/s2If] [s2If current_user_can(access_s2member_level1)]
- USD/CNH reverses from seven-month high, prints the first daily loss in four.
The pair currently trades last at 7.22314.
The previous day high was 7.247 while the previous day low was 7.206. The daily 38.2% Fib levels comes at 7.2313, expected to provide resistance. Similarly, the daily 61.8% fib level is at 7.2216, expected to provide support.
USD/CNH remains pressured around the intraday low of 7.2138, near 7.2240 by the press time, as it prints the first daily loss in three while reversing from the highest level since November 2022 during early Tuesday.
In doing so, the offshore Chinese Yuan (CNH) pair benefits from the People’s Bank of China’s (PBoC) latest move, as well as optimism about China’s economy, as well as the risk-positive headlines from the Asian lobbyists.
That said, PBoC’s lower-than-expected fixing of the USD/CNY price recently pushed back the fears surrounding the world’s second-biggest economy. That said, the PBoC set the USD/CNY central rate at 7.2098 on Tuesday, versus the previous fix of 7.2056 and market expectations of 7.2194. It’s worth noting that the USD/CNY closed near 7.2425 the previous day. With this, the Chinese central bank sets the onshore Yuan (CNY) rate at the lowest level since November 2022.
On the same line, headlines from Reuters suggesting the Asian lobby group’s push for an easing of Chinese companies’ overseas listing also underpins the market’s latest optimism about China, which in turn weighs on the USD/CNH price.
“China’s new offshore listing rules for domestic companies have left bankers and lawyers who work on listings unsure how to take on liabilities and how to avoid breaching tightened confidentially rules, Asia’s largest financial lobby group said on Tuesday,” said Reuters.
“Lobby group ASIFMA (the Asia Securities Industry and Financial Markets Association) counts leading global investment banks Goldman Sachs, JPMorgan Chase & Co, and UBS Group among more than 170 financial firms who are association members,” added the news.
Elsewhere, the easing of the Russia-linked geopolitical concerns, after the Wagner Group drops Moscow’s mutiny and President Vladimir Putin praised the mercenary’s decision to retreat, also allow traders to remain optimistic and weigh on the USD/CNH price.
Amid these plays, S&P500 Futures print the first daily gains in three by bouncing off the lowest levels in eight days, up 0.20% intraday near 4,380 at the latest. That said, the US 10-year and two-year Treasury bond yields remain depressed at around 3.73% and 4.69% by the press time.
Looking forward, US Durable Goods Orders for May, expected -1.0% versus 1.1% prior, as well as the US Conference Board’s (CB) Consumer Confidence for June, expected to arrive at 103.90 versus 102.30 prior, will direct intraday moves of the USD/CNH pair. Additionally, important will be European Central Bank (ECB) President Christine Lagarde’s speech at the ECB Forum.
Although the overbought RSI conditions challenge the USD/CNH buyers below the late 2022 peak of around 7.2600, a two-month-old rising trend channel, currently between 7.2640 and 7.1690, suggests further upside of the offshore Chinese Yuan pair.
Technical Levels: Supports and Resistances
USDCNH currently trading at 7.2258 at the time of writing. Pair opened at 7.2424 and is trading with a change of -0.23% % .
| Overview | Overview.1 | |
|---|---|---|
| 0 | Today last price | 7.2258 |
| 1 | Today Daily Change | -0.0166 |
| 2 | Today Daily Change % | -0.23% |
| 3 | Today daily open | 7.2424 |
The pair remains strongly bullish on the daily timeframe. It trades above its 20 SMA @ 7.1509, 50 SMA 7.0413, 100 SMA @ 6.9633 and 200 SMA @ 6.9981.
| Trends | Trends.1 | |
|---|---|---|
| 0 | Daily SMA20 | 7.1509 |
| 1 | Daily SMA50 | 7.0413 |
| 2 | Daily SMA100 | 6.9633 |
| 3 | Daily SMA200 | 6.9981 |
The previous day high was 7.247 while the previous day low was 7.206. The daily 38.2% Fib levels comes at 7.2313, expected to provide resistance. Similarly, the daily 61.8% fib level is at 7.2216, expected to provide support.
Note the levels of interest below:
- Pivot support is noted at 7.2166, 7.1908, 7.1756
- Pivot resistance is noted at 7.2576, 7.2728, 7.2986
| Levels | Levels.1 |
|---|---|
| Previous Daily High | 7.2470 |
| Previous Daily Low | 7.2060 |
| Previous Weekly High | 7.2286 |
| Previous Weekly Low | 7.1280 |
| Previous Monthly High | 7.1344 |
| Previous Monthly Low | 6.8962 |
| Daily Fibonacci 38.2% | 7.2313 |
| Daily Fibonacci 61.8% | 7.2216 |
| Daily Pivot Point S1 | 7.2166 |
| Daily Pivot Point S2 | 7.1908 |
| Daily Pivot Point S3 | 7.1756 |
| Daily Pivot Point R1 | 7.2576 |
| Daily Pivot Point R2 | 7.2728 |
| Daily Pivot Point R3 | 7.2986 |
[/s2If]
Nehcap Expert Advisor
The NEHCAP MT4 EA is high quality professional trading system geared to generate returns without using GRID or martingales. Each trade has strict risk per trade parameter. The pairs under management include EURUSD, GBPUSD, AUDCAD, AUDNZD,GBPAUD, EURAUD, EURCAD, CHFJPY and many more.
The system is trading live: LIVE ACCOUNT TRACKING
You can run it free. Apply for a free trial and track our account. Buy the system or use profit share mechanism to generate returns on your MT4.
Join Our Telegram Group
")


