The XAGUSD at 22.844 is struggling to stay above the significant 200-day EMA, indicating the possibility of a downward trend.
…
This is a premium post.
[s2If !current_user_can(access_s2member_level4)]Please register for FREE REGISTER to read full post below containing analysis. In case of any error or you think you are not able to read the full post below, please email us at support#nehcap.com [lwa][/s2If] [s2If current_user_can(access_s2member_level1)]
- XAG/USD fails to cling above key 200-day EMA, hints at a downside
The pair currently trades last at 22.844.
The previous day high was 22.89 while the previous day low was 22.42. The daily 38.2% Fib levels comes at 22.71, expected to provide support. Similarly, the daily 61.8% fib level is at 22.6, expected to provide support.
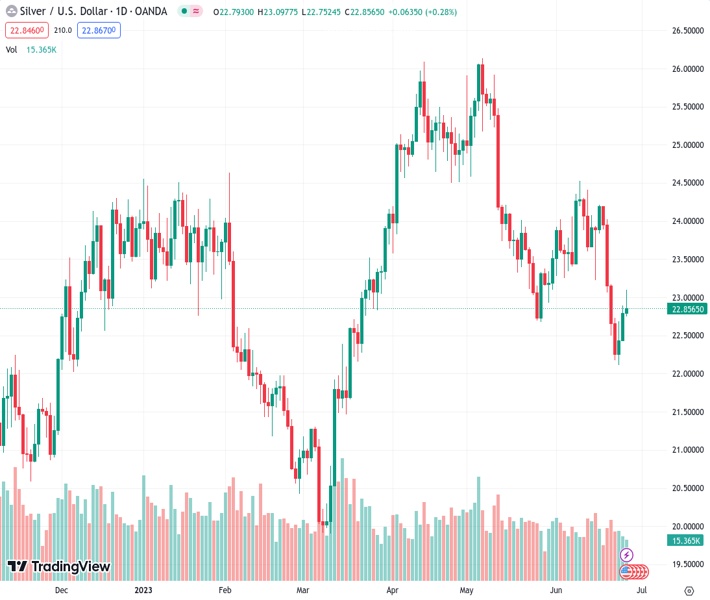
Silver price recovered some ground and tested the 200-day Exponential Moving Average (EMA) but failed to cling above the latter, opening the door for further downside. Hence, Wednesday’s price action is set to form an inverted hammer, preceded by an uptrend, warranting downward action. At the time of writing, the XAG/USD is trading at $22.87, clinging to its gains of 0.47%.
After piercing the 200-day EMA at $22.94 and reaching a new weekly high of $23.09, the XAG/USD retraced most of its gains, tumbling back below two key resistance areas: the 1.2300 figure and the 200-day EMA. In addition, the Relative Strength Index (RSI) indicator is still bearishly biased, while the three-day Rate of Change (RoC) jumped the most since June 9, offering bullish signals. That said, caution is warranted amidst mixed signals between oscillators.
If XAG/USD extends its gains past the 200-day EMA, it could open the door for further upside. Key resistance levels lie at $23.00 per troy ounce, followed by the June 15 low of $23.22, before testing the 20-day EMA at $23.32. A breach of the latter will expose the 100-day EMA at $23.23.
Conversely, the most likely scenario for XAG/USD is the near term; the first support would be a May 26 low of $22.68. Once cleared, XAG/USD could dive to June’s 23 low at $22.11 before challenging the $22.00 psychological level.
Technical Levels: Supports and Resistances
XAGUSD currently trading at 22.86 at the time of writing. Pair opened at 22.78 and is trading with a change of 0.35 % .
| Overview | Overview.1 | |
|---|---|---|
| 0 | Today last price | 22.86 |
| 1 | Today Daily Change | 0.08 |
| 2 | Today Daily Change % | 0.35 |
| 3 | Today daily open | 22.78 |
The pair is trading below its 20 Daily moving average @ 23.52, below its 50 Daily moving average @ 24.14 , below its 100 Daily moving average @ 23.32 and above its 200 Daily moving average @ 22.51
| Trends | Trends.1 | |
|---|---|---|
| 0 | Daily SMA20 | 23.52 |
| 1 | Daily SMA50 | 24.14 |
| 2 | Daily SMA100 | 23.32 |
| 3 | Daily SMA200 | 22.51 |
The previous day high was 22.89 while the previous day low was 22.42. The daily 38.2% Fib levels comes at 22.71, expected to provide support. Similarly, the daily 61.8% fib level is at 22.6, expected to provide support.
Note the levels of interest below:
- Pivot support is noted at 22.51, 22.23, 22.04
- Pivot resistance is noted at 22.98, 23.17, 23.45
| Levels | Levels.1 |
|---|---|
| Previous Daily High | 22.89 |
| Previous Daily Low | 22.42 |
| Previous Weekly High | 24.20 |
| Previous Weekly Low | 22.11 |
| Previous Monthly High | 26.14 |
| Previous Monthly Low | 22.68 |
| Daily Fibonacci 38.2% | 22.71 |
| Daily Fibonacci 61.8% | 22.60 |
| Daily Pivot Point S1 | 22.51 |
| Daily Pivot Point S2 | 22.23 |
| Daily Pivot Point S3 | 22.04 |
| Daily Pivot Point R1 | 22.98 |
| Daily Pivot Point R2 | 23.17 |
| Daily Pivot Point R3 | 23.45 |
[/s2If]
Nehcap Expert Advisor
The NEHCAP MT4 EA is high quality professional trading system geared to generate returns without using GRID or martingales. Each trade has strict risk per trade parameter. The pairs under management include EURUSD, GBPUSD, AUDCAD, AUDNZD,GBPAUD, EURAUD, EURCAD, CHFJPY and many more.
The system is trading live: LIVE ACCOUNT TRACKING
You can run it free. Apply for a free trial and track our account. Buy the system or use profit share mechanism to generate returns on your MT4.
Join Our Telegram Group
")


