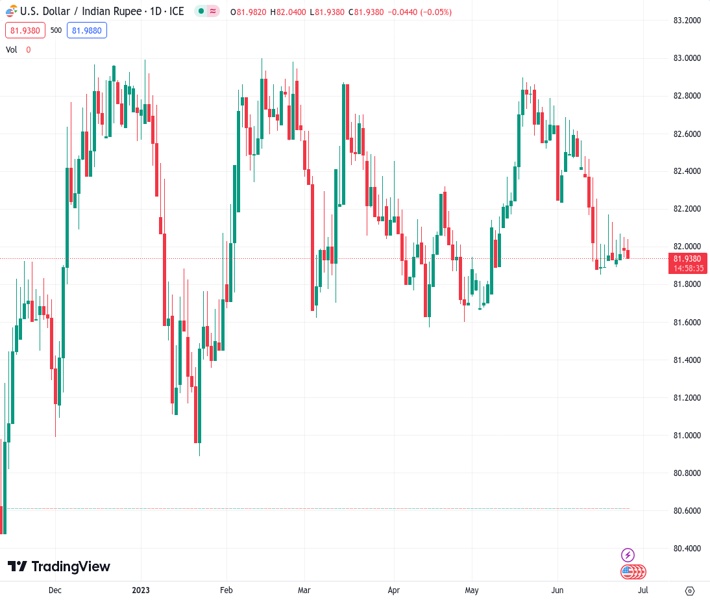
The USDINR, which hit 81.9580, experiences its first daily decline in three days and remains under pressure near its recent intraday low.
…
This is a premium post.
[s2If !current_user_can(access_s2member_level4)]Please register for FREE REGISTER to read full post below containing analysis. In case of any error or you think you are not able to read the full post below, please email us at support#nehcap.com [lwa][/s2If] [s2If current_user_can(access_s2member_level1)]
- USD/INR prints the first daily loss in three, stays pressured around intraday low of late.
The pair currently trades last at 81.9580.
The previous day high was 82.105 while the previous day low was 81.94. The daily 38.2% Fib levels comes at 82.042, expected to provide resistance. Similarly, the daily 61.8% fib level is at 82.003, expected to provide resistance.
USD/INR returns to the bear’s radar, following a two-day absence, as it slides to 81.95 heading into Tuesday’s European session. In doing so, the Indian Rupee (INR) pair benefits from optimism in Asia, as well as the US Dollar’s positioning for the key data/events.
That said, the market sentiment remains mildly positive due to the risk-positive headlines surrounding China. Earlier in the day, the People’s Bank of China (PBoC) fixed a lower-than-expected USD/CNY price to weigh on the US Dollar and push back the chatters about the dragon nation’s economic weakness. On the same line was news was the alleged selling of the US Dollar by the Chinese state banks in the offshore currency markets, as well as the Asian lobbyists’ push for easies rules for Chinese equities’ overseas listing.
Furthermore, headlines suggesting an end to fears surrounding Moscow’s mutiny allow the traders to remain optimistic.
Alternatively, firmer Oil price joins the previous day’s upbeat US data and hawkish Fed signals to challenge the USD/INR bears.
WTI crude oil prints the biggest daily gains in three around $70.00 by the press time as hopes of more demand from China jostle with chatters of a Russia-inflicted supply crunch.
Elsewhere, US Dallas Fed Manufacturing Business Index for June improved to -23.2 versus -26.5 expected and -29.1 previous readings. During the last week, the US Core inflation for May allowed Fed Chairman Jerome Powell to remain hawkish but the Purchasing Managers’ Indexes for June weren’t impressive enough. Even so, Federal Reserve Bank of San Francisco President Mary Daly signaled on Friday that two more interest rate increases this year would be a “very reasonable projection.”
Against this backdrop, S&P500 Futures print mild gains but the MSCI’s Index of Asia-Pacific shares outside Japan rises 0.80% intraday low while bouncing off the three-week low marked the previous day.
Looking ahead, multiple central bankers’ speeches from the European Central Bank (ECB) Forum will be important to watch for intraday market directions. Also, US Durable Goods Orders for May, expected -at 1.0% versus 1.1% prior, as well as the US Conference Board’s (CB) Consumer Confidence for June, expected to arrive at 103.90 versus 102.30 prior, shouldn’t be missed for intraday USD/INR guide.
A one-week-old symmetrical triangle, currently between 81.90 and 82.10, restricts immediate USD/INR moves amid sluggish oscillators. It’s worth noting, however, that the pair’s sustained trading below the 200-DMA, around 82.15 by the press time, keeps the bears hopeful.
Technical Levels: Supports and Resistances
USDINR currently trading at 82.0363 at the time of writing. Pair opened at 81.9985 and is trading with a change of 0.05% % .
| Overview | Overview.1 | |
|---|---|---|
| 0 | Today last price | 82.0363 |
| 1 | Today Daily Change | 0.0378 |
| 2 | Today Daily Change % | 0.05% |
| 3 | Today daily open | 81.9985 |
The pair remains strongly bearish on the daily time frame. It trades below the 20 SMA @ 82.2475, 50 SMA 82.2107, 100 SMA @ 82.2778 and 200 SMA @ 82.1211.
| Trends | Trends.1 | |
|---|---|---|
| 0 | Daily SMA20 | 82.2475 |
| 1 | Daily SMA50 | 82.2107 |
| 2 | Daily SMA100 | 82.2778 |
| 3 | Daily SMA200 | 82.1211 |
The previous day high was 82.105 while the previous day low was 81.94. The daily 38.2% Fib levels comes at 82.042, expected to provide resistance. Similarly, the daily 61.8% fib level is at 82.003, expected to provide resistance.
Note the levels of interest below:
- Pivot support is noted at 81.924, 81.8495, 81.759
- Pivot resistance is noted at 82.089, 82.1795, 82.254
| Levels | Levels.1 |
|---|---|
| Previous Daily High | 82.1050 |
| Previous Daily Low | 81.9400 |
| Previous Weekly High | 82.1725 |
| Previous Weekly Low | 81.8845 |
| Previous Monthly High | 82.9810 |
| Previous Monthly Low | 81.6435 |
| Daily Fibonacci 38.2% | 82.0420 |
| Daily Fibonacci 61.8% | 82.0030 |
| Daily Pivot Point S1 | 81.9240 |
| Daily Pivot Point S2 | 81.8495 |
| Daily Pivot Point S3 | 81.7590 |
| Daily Pivot Point R1 | 82.0890 |
| Daily Pivot Point R2 | 82.1795 |
| Daily Pivot Point R3 | 82.2540 |
[/s2If]
Nehcap Expert Advisor
The NEHCAP MT4 EA is high quality professional trading system geared to generate returns without using GRID or martingales. Each trade has strict risk per trade parameter. The pairs under management include EURUSD, GBPUSD, AUDCAD, AUDNZD,GBPAUD, EURAUD, EURCAD, CHFJPY and many more.
The system is trading live: LIVE ACCOUNT TRACKING
You can run it free. Apply for a free trial and track our account. Buy the system or use profit share mechanism to generate returns on your MT4.
Join Our Telegram Group
")


