The USDCAD exchange rate at 1.31307 has been on a downward trend for two consecutive days and is influenced by several factors.
…
This is a premium post.
[s2If !current_user_can(access_s2member_level4)]Please register for FREE REGISTER to read full post below containing analysis. In case of any error or you think you are not able to read the full post below, please email us at support#nehcap.com [lwa][/s2If] [s2If current_user_can(access_s2member_level1)]
- USD/CAD drifts lower for the second straight day and is pressured by a combination of actors.
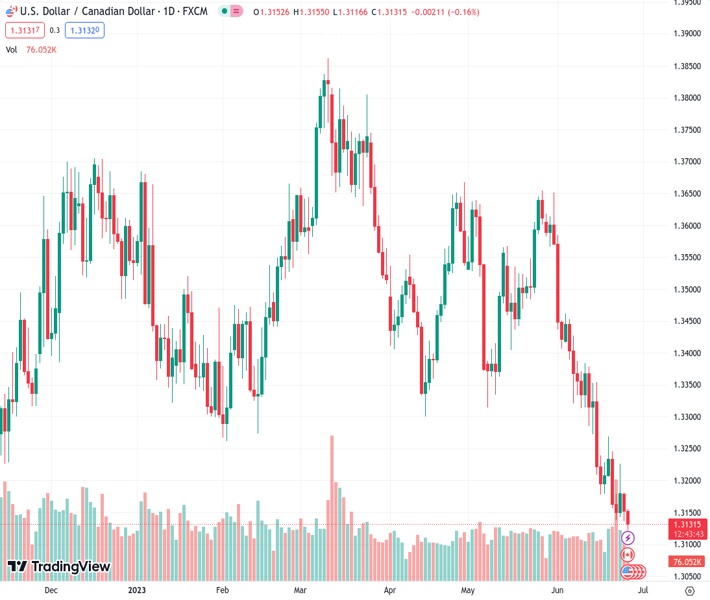
The pair currently trades last at 1.31307.
The previous day high was 1.3183 while the previous day low was 1.3136. The daily 38.2% Fib levels comes at 1.3154, expected to provide resistance. Similarly, the daily 61.8% fib level is at 1.3165, expected to provide resistance.
The USD/CAD pair now seems to have entered a bearish consolidation phase and is seen oscillating in a narrow band around the 1.3120-1.3125 area, just above its lowest level since September 2022 touched this Tuesday.
A combination of factors lends some support to Crude Oil prices, which, in turn, underpins the commodity-linked Loonie and drags the USD/CAD pair lower for the second straight day amid the prevalent US Dollar (USD) selling bias. Political instability in Russia raised concerns about possible supply disruptions. Furthermore, China’s Premier Li Qiang said that domestic economic growth is expected to reach the annual projected target of around 5%. This, in turn, lifts hopes for a pickup in fuel demand ahead of the summer driving season in the US and acts as a tailwind for the black liquid.
The latest optimism, meanwhile, is evident from a modest recovery in the global risk sentiment and a generally positive tone around the equity markets. The risk-on flow is seen denting the Greenback’s relative safe-haven status and exerting additional downward pressure on the USD/CAD pair. That said, the Federal Reserve’s (Fed) hawkish outlook helps limit losses for the USD. Traders also seem reluctant to place aggressive bets and prefer to wait for the release of the latest Canadian consumer inflation figures, due later during the North American session, for a fresh impetus.
Consensus estimates point to a sharp deceleration in the Canadian headline CPI, from a 4.4% YoY rate to 3.4% in May. Moreover, the Bank of Canada’s (BoC) Core CPI is projected to ease to 3.9% from 4.1% in April. The markets, however, have been pricing in a greater chance of another 25 bps BoC rate hike in July. Hence, a larger drop in headline CPI is unlikely to diminish the odds for the anticipated lift-off, though might still infuse some volatility around the USD/CAD pair. Apart from this, traders will take cues from a slew of important US macro data to grab short-term opportunities.
Tuesday’s US economic docket features Durable Goods Orders, the Conference Board’s Consumer Confidence Index, New Home Sales and Richmond Manufacturing Index, which might influence the USD. Apart from this, Oil price dynamics will be looked up for some meaningful impetus to the USD/CAD pair. Nevertheless, the aforementioned fundamental backdrop suggests that the path of least resistance for spot prices is to the downside. Hence, any attempted recovery might still be seen as a selling opportunity and runs the risk of fizzling out rather quickly.
Technical Levels: Supports and Resistances
USDCAD currently trading at 1.3123 at the time of writing. Pair opened at 1.3154 and is trading with a change of -0.24 % .
| Overview | Overview.1 | |
|---|---|---|
| 0 | Today last price | 1.3123 |
| 1 | Today Daily Change | -0.0031 |
| 2 | Today Daily Change % | -0.2400 |
| 3 | Today daily open | 1.3154 |
The pair remains strongly bearish on the daily time frame. It trades below the 20 SMA @ 1.3325, 50 SMA 1.3441, 100 SMA @ 1.3502 and 200 SMA @ 1.3519.
| Trends | Trends.1 | |
|---|---|---|
| 0 | Daily SMA20 | 1.3325 |
| 1 | Daily SMA50 | 1.3441 |
| 2 | Daily SMA100 | 1.3502 |
| 3 | Daily SMA200 | 1.3519 |
The previous day high was 1.3183 while the previous day low was 1.3136. The daily 38.2% Fib levels comes at 1.3154, expected to provide resistance. Similarly, the daily 61.8% fib level is at 1.3165, expected to provide resistance.
Note the levels of interest below:
- Pivot support is noted at 1.3133, 1.3111, 1.3085
- Pivot resistance is noted at 1.318, 1.3205, 1.3227
| Levels | Levels.1 |
|---|---|
| Previous Daily High | 1.3183 |
| Previous Daily Low | 1.3136 |
| Previous Weekly High | 1.3270 |
| Previous Weekly Low | 1.3139 |
| Previous Monthly High | 1.3655 |
| Previous Monthly Low | 1.3315 |
| Daily Fibonacci 38.2% | 1.3154 |
| Daily Fibonacci 61.8% | 1.3165 |
| Daily Pivot Point S1 | 1.3133 |
| Daily Pivot Point S2 | 1.3111 |
| Daily Pivot Point S3 | 1.3085 |
| Daily Pivot Point R1 | 1.3180 |
| Daily Pivot Point R2 | 1.3205 |
| Daily Pivot Point R3 | 1.3227 |
[/s2If]
Nehcap Expert Advisor
The NEHCAP MT4 EA is high quality professional trading system geared to generate returns without using GRID or martingales. Each trade has strict risk per trade parameter. The pairs under management include EURUSD, GBPUSD, AUDCAD, AUDNZD,GBPAUD, EURAUD, EURCAD, CHFJPY and many more.
The system is trading live: LIVE ACCOUNT TRACKING
You can run it free. Apply for a free trial and track our account. Buy the system or use profit share mechanism to generate returns on your MT4.
Join Our Telegram Group
")


