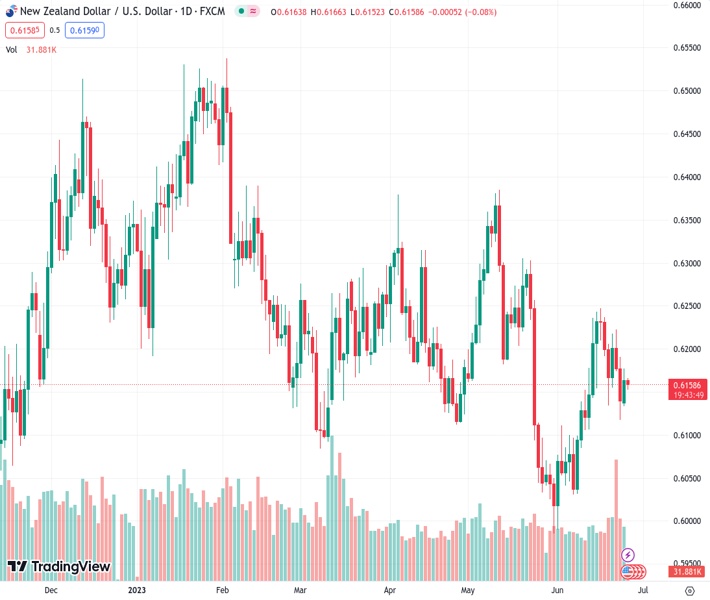
The NZDUSD currency pair, trading at 0.61614, is facing difficulty in maintaining the gains achieved in the previous day’s recovery, as it remains within a bearish channel that has been in existence for a week. Furthermore, it is trading below the 50-day simple moving average. According to the opinion of @nehcap, the outlook for the NZDUSD is negative.
…
This is a premium post.
[s2If !current_user_can(access_s2member_level4)]Please register for FREE REGISTER to read full post below containing analysis. In case of any error or you think you are not able to read the full post below, please email us at support#nehcap.com [lwa][/s2If] [s2If current_user_can(access_s2member_level1)]
- NZD/USD struggles to defend the previous day’s recovery within one-week-old bearish channel, stays below 50-SMA.
The pair currently trades last at 0.61614.
The previous day high was 0.6178 while the previous day low was 0.6137. The daily 38.2% Fib levels comes at 0.6162, expected to provide resistance. Similarly, the daily 61.8% fib level is at 0.6153, expected to provide support.
NZD/USD edges lower past 0.6200 despite the week-start rebound, pressured around 0.6165 amid Tuesday’s Asian session. In doing so, the Kiwi pair stays within a one-week-old bearish channel, as well as remains below the 50-SMA hurdle, while fading the previous week’s rebound from the monthly support line.
It’s worth noting that the steady conditions of the RSI (14) line around 50.0 levels also keep the Kiwi pair sellers hopeful despite the latest corrective bounce.
That said, an upward-sloping trend line from May 31, close to 0.6135 at the latest, appears immediate support for the NZD/USD sellers to watch during the quote’s fresh downside.
Following that, the stated channel’s bottom line surrounding 0.6110 and the 0.6100 round figure may prod the bears.
In a case where the Kiwi pair drops below 0.6100, multiple supports around 0.6030-25 may prod the sellers before directing them to the 0.6000 psychological magnet and the yearly low marked in May around 0.5985.
On the contrary, the 50-SMA and the aforementioned bearish channel’s top line, respectively near 0.6185 and 0.6210 restrict the short-term recovery of the NZD/USD pair.
However, the Kiwi buyers should remain cautious unless witnessing a clear upside break of the descending resistance line from May 19, close to 0.6230 at the latest.
Trend: Bearish
Technical Levels: Supports and Resistances
NZDUSD currently trading at 0.6161 at the time of writing. Pair opened at 0.6165 and is trading with a change of -0.06% % .
| Overview | Overview.1 | |
|---|---|---|
| 0 | Today last price | 0.6161 |
| 1 | Today Daily Change | -0.0004 |
| 2 | Today Daily Change % | -0.06% |
| 3 | Today daily open | 0.6165 |
The pair is trading above its 20 Daily moving average @ 0.6129, below its 50 Daily moving average @ 0.6172 , below its 100 Daily moving average @ 0.6203 and above its 200 Daily moving average @ 0.6157
| Trends | Trends.1 | |
|---|---|---|
| 0 | Daily SMA20 | 0.6129 |
| 1 | Daily SMA50 | 0.6172 |
| 2 | Daily SMA100 | 0.6203 |
| 3 | Daily SMA200 | 0.6157 |
The previous day high was 0.6178 while the previous day low was 0.6137. The daily 38.2% Fib levels comes at 0.6162, expected to provide resistance. Similarly, the daily 61.8% fib level is at 0.6153, expected to provide support.
Note the levels of interest below:
- Pivot support is noted at 0.6142, 0.6119, 0.6101
- Pivot resistance is noted at 0.6183, 0.6201, 0.6224
| Levels | Levels.1 |
|---|---|
| Previous Daily High | 0.6178 |
| Previous Daily Low | 0.6137 |
| Previous Weekly High | 0.6237 |
| Previous Weekly Low | 0.6116 |
| Previous Monthly High | 0.6385 |
| Previous Monthly Low | 0.5985 |
| Daily Fibonacci 38.2% | 0.6162 |
| Daily Fibonacci 61.8% | 0.6153 |
| Daily Pivot Point S1 | 0.6142 |
| Daily Pivot Point S2 | 0.6119 |
| Daily Pivot Point S3 | 0.6101 |
| Daily Pivot Point R1 | 0.6183 |
| Daily Pivot Point R2 | 0.6201 |
| Daily Pivot Point R3 | 0.6224 |
[/s2If]
Nehcap Expert Advisor
The NEHCAP MT4 EA is high quality professional trading system geared to generate returns without using GRID or martingales. Each trade has strict risk per trade parameter. The pairs under management include EURUSD, GBPUSD, AUDCAD, AUDNZD,GBPAUD, EURAUD, EURCAD, CHFJPY and many more.
The system is trading live: LIVE ACCOUNT TRACKING
You can run it free. Apply for a free trial and track our account. Buy the system or use profit share mechanism to generate returns on your MT4.
Join Our Telegram Group
")


