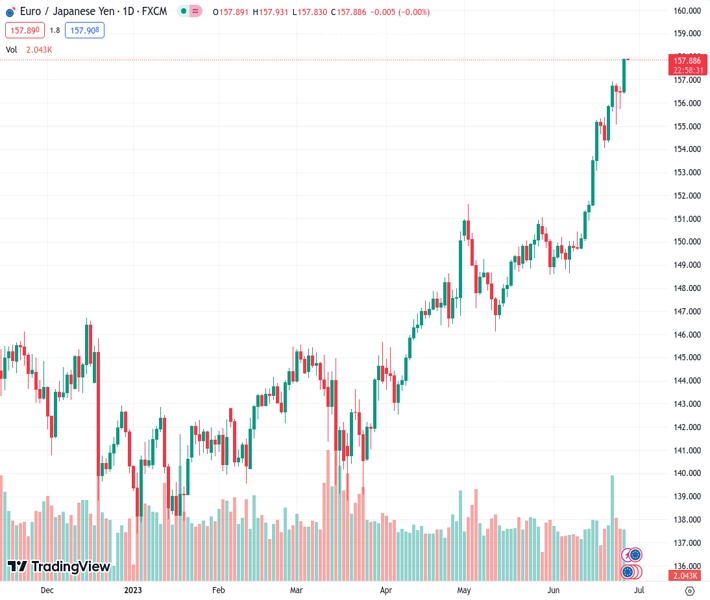
The EURJPY reached its highest point in nearly 13 years, climbing to 157.93 from its previous level of 157.853 in August 2008.
…
This is a premium post.
[s2If !current_user_can(access_s2member_level4)]Please register for FREE REGISTER to read full post below containing analysis. In case of any error or you think you are not able to read the full post below, please email us at support#nehcap.com [lwa][/s2If] [s2If current_user_can(access_s2member_level1)]
- The EUR/JPY rose to its highest level since August 2008 to 157.93.
The pair currently trades last at 157.853.
The previous day high was 156.72 while the previous day low was 155.75. The daily 38.2% Fib levels comes at 156.12, expected to provide support. Similarly, the daily 61.8% fib level is at 156.35, expected to provide support.
On Tuesday, the EUR/JPY continued gaining ground, now jumping to a 15-year high of around 157.93. In that sense, hawkish European Central Bank’s (ECB) president Christine Lagarde, fueled a rise in German bond yields supporting the Euro. On the other hand, investors monitor the USD/JPY for a potential Bank of Japan (BoJ) intervention which could bolster the yen. In addition, strong US data weakened US yields which could also limit the Yen’s losses.
During the ECB forum on Tuesday, ECB’s Lagarde commented that inflation in the eurozone is still too high and that interest rates are to remain high as long as necessary. Other officials also hinted at additional hikes as Mārtiņš Kazāks commented that he sees rates being hiked in July. As a reaction, German bond yields rose, with the 2-year bond yield leading the way, rising more than 1% to 3.18%. As rising bond yields attract investors, the Euro currency found demand and gained appeal.
That being said, the Yen may find on the prospects of a BoJ intervention if the Japanese currency continues to lose value against the USD. Focus now shift to Wednesday’s Jerome Powell speech in the ECB forum, where investors will look for clues regarding the Federal Reserve’s (Fed) next steps, which could affect the mentioned pair price dynamics and hence the Yen. It’s worth noticing that Housing and Durable Goods from May and April came in above expectations on Tuesday so that investors will put an eye on Powell’s analysis in the economic activity outlook.
According to the daily chart, the cross holds a bullish outlook for the short-term but a correction shouldn’t be taken off the table as indicators; specifically, the Relative Strength (RSI), has stood in overbought territory since mid-June.
In case of a technical correction, support levels line up at 157.00, 156.50 and 156.00, the nearest round levels. On the flip side, resistances line up at 158.00, 158.50 and 159.00.
Technical Levels: Supports and Resistances
EURJPY currently trading at 157.9 at the time of writing. Pair opened at 156.51 and is trading with a change of 0.89 % .
| Overview | Overview.1 | |
|---|---|---|
| 0 | Today last price | 157.90 |
| 1 | Today Daily Change | 1.39 |
| 2 | Today Daily Change % | 0.89 |
| 3 | Today daily open | 156.51 |
The pair remains strongly bullish on the daily timeframe. It trades above its 20 SMA @ 152.2, 50 SMA 150.07, 100 SMA @ 146.76 and 200 SMA @ 144.86.
| Trends | Trends.1 | |
|---|---|---|
| 0 | Daily SMA20 | 152.20 |
| 1 | Daily SMA50 | 150.07 |
| 2 | Daily SMA100 | 146.76 |
| 3 | Daily SMA200 | 144.86 |
The previous day high was 156.72 while the previous day low was 155.75. The daily 38.2% Fib levels comes at 156.12, expected to provide support. Similarly, the daily 61.8% fib level is at 156.35, expected to provide support.
Note the levels of interest below:
- Pivot support is noted at 155.93, 155.36, 154.96
- Pivot resistance is noted at 156.91, 157.3, 157.88
| Levels | Levels.1 |
|---|---|
| Previous Daily High | 156.72 |
| Previous Daily Low | 155.75 |
| Previous Weekly High | 156.93 |
| Previous Weekly Low | 154.05 |
| Previous Monthly High | 151.62 |
| Previous Monthly Low | 146.14 |
| Daily Fibonacci 38.2% | 156.12 |
| Daily Fibonacci 61.8% | 156.35 |
| Daily Pivot Point S1 | 155.93 |
| Daily Pivot Point S2 | 155.36 |
| Daily Pivot Point S3 | 154.96 |
| Daily Pivot Point R1 | 156.91 |
| Daily Pivot Point R2 | 157.30 |
| Daily Pivot Point R3 | 157.88 |
[/s2If]
Nehcap Expert Advisor
The NEHCAP MT4 EA is high quality professional trading system geared to generate returns without using GRID or martingales. Each trade has strict risk per trade parameter. The pairs under management include EURUSD, GBPUSD, AUDCAD, AUDNZD,GBPAUD, EURAUD, EURCAD, CHFJPY and many more.
The system is trading live: LIVE ACCOUNT TRACKING
You can run it free. Apply for a free trial and track our account. Buy the system or use profit share mechanism to generate returns on your MT4.
Join Our Telegram Group
")


