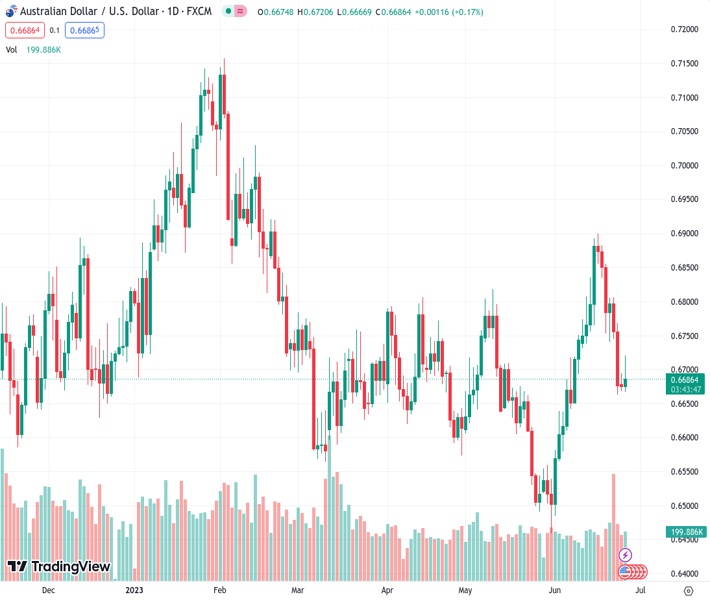
The AUDUSD pair at a rate of 0.66856 falls back from its peak during the week due to the robust economic performance of the United States.
…
This is a premium post.
[s2If !current_user_can(access_s2member_level4)]Please register for FREE REGISTER to read full post below containing analysis. In case of any error or you think you are not able to read the full post below, please email us at support#nehcap.com [lwa][/s2If] [s2If current_user_can(access_s2member_level1)]
- AUD/USD retreats from weekly highs amidst strong US economic performance.
The pair currently trades last at 0.66856.
The previous day high was 0.6694 while the previous day low was 0.6668. The daily 38.2% Fib levels comes at 0.6678, expected to provide support. Similarly, the daily 61.8% fib level is at 0.6684, expected to provide support.
AUD/USD remains in positive territory but retreats from weekly highs of 0.6720, falls below the 0.6700 figure, after upbeat economic data from the United States (US) further cements the case for a rate hike in July, ahead of Federal Reserve (Fed) Chair Jerome Powell speech at Sintra. The AUD/USD is trading at 0.6680, clinging to its minuscule gains of 0.08%.
Investors’ sentiment remains positive after a tranche of US data showed the economy’s resilience amidst 500 basis points of tightening. The US Department of Commerce revealed that Durable Good Orders rose above estimates and crushed April’s data, which was upward revised. The figures came at 1.7% MoM, above forecasts of a -1% plunge and April’s 1.2% expansion.
Of late, US New Home Sales grew at the fastest pace over one year, climbing 12.2% MoM in May vs. 3.5% expansion in April. New home Sales hit the 763K threshold, above April’s 680K. At the same time, the Conference Board (CB) revealed that Consumer Confidence in June improved to 109.7, crushing estimates of 104 and above May’s 10.5 figures. The survey showed an improvement in the labor market, with inflation slowing and income expectations downtick.
Given the fundamental backdrop, the AUD/USD erased part of its earlier gains that lifted the major toward its daily/weekly high. Two catalysts that can move the AUD/USD are looming, with Australia’s Consumer Price Index (CPI) release, before Fed Chair Jerome Powell’s speech at Sintra.
Australia’s CPI is expected to soften to 6.1% YoY, lower than April’s 6.8%. Any upward surprises on inflation would dictate the Reserve Bank of Australia’s (RBA) next movement after increasing rates in June to 4.10%. Money market futures portrays a 23% chance the RBA will raise rates to 4.35%.
On Wednesday, Fed Chair Jerome Powell will speak at the European Central Bank (ECB) Sintra event and is expected to reiterate the US central bank eyes two additional rate hikes, but no surprises are on the docket. Despite the Fed dot plots revision of peak rates above 5.50%, the CME FedWatch Tool shows market participants do not believe the Fed will raise rates past the 5.25%-5.50% range.
The AUD/USD is neutral to downward biased after diving below the 200-day Exponential Moving Average (EMA), with the fall extending past the 100, 50, and 20-day EMAs. AUD buyers must reclaim 0.6700 to keep their hopes for higher prices. Otherwise, the AUD/USD path of least resistance will accelerate its downtrend once sellers surpass the June 23 low of 0.6662. After that, the AUD/USD next demand area would be the May 18 low of 0.6605 before dropping to the 0.6500 handle.
Technical Levels: Supports and Resistances
AUDUSD currently trading at 0.6685 at the time of writing. Pair opened at 0.6675 and is trading with a change of 0.15 % .
| Overview | Overview.1 | |
|---|---|---|
| 0 | Today last price | 0.6685 |
| 1 | Today Daily Change | 0.0010 |
| 2 | Today Daily Change % | 0.1500 |
| 3 | Today daily open | 0.6675 |
The pair is trading below its 20 Daily moving average @ 0.6711, above its 50 Daily moving average @ 0.668 , below its 100 Daily moving average @ 0.6712 and below its 200 Daily moving average @ 0.6692
| Trends | Trends.1 | |
|---|---|---|
| 0 | Daily SMA20 | 0.6711 |
| 1 | Daily SMA50 | 0.6680 |
| 2 | Daily SMA100 | 0.6712 |
| 3 | Daily SMA200 | 0.6692 |
The previous day high was 0.6694 while the previous day low was 0.6668. The daily 38.2% Fib levels comes at 0.6678, expected to provide support. Similarly, the daily 61.8% fib level is at 0.6684, expected to provide support.
Note the levels of interest below:
- Pivot support is noted at 0.6664, 0.6653, 0.6638
- Pivot resistance is noted at 0.669, 0.6705, 0.6717
| Levels | Levels.1 |
|---|---|
| Previous Daily High | 0.6694 |
| Previous Daily Low | 0.6668 |
| Previous Weekly High | 0.6886 |
| Previous Weekly Low | 0.6663 |
| Previous Monthly High | 0.6818 |
| Previous Monthly Low | 0.6458 |
| Daily Fibonacci 38.2% | 0.6678 |
| Daily Fibonacci 61.8% | 0.6684 |
| Daily Pivot Point S1 | 0.6664 |
| Daily Pivot Point S2 | 0.6653 |
| Daily Pivot Point S3 | 0.6638 |
| Daily Pivot Point R1 | 0.6690 |
| Daily Pivot Point R2 | 0.6705 |
| Daily Pivot Point R3 | 0.6717 |
[/s2If]
Nehcap Expert Advisor
The NEHCAP MT4 EA is high quality professional trading system geared to generate returns without using GRID or martingales. Each trade has strict risk per trade parameter. The pairs under management include EURUSD, GBPUSD, AUDCAD, AUDNZD,GBPAUD, EURAUD, EURCAD, CHFJPY and many more.
The system is trading live: LIVE ACCOUNT TRACKING
You can run it free. Apply for a free trial and track our account. Buy the system or use profit share mechanism to generate returns on your MT4.
Join Our Telegram Group
")


