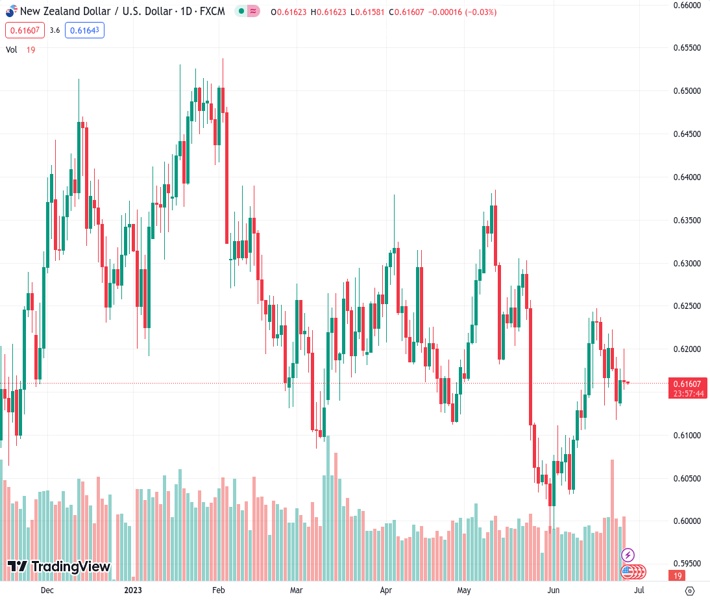
On Tuesday, the NZDUSD pair fluctuated between 0.6200 and 0.6155 and maintained its position above the 100-day Simple Moving Average (SMA).
…
This is a premium post.
[s2If !current_user_can(access_s2member_level4)]Please register for FREE REGISTER to read full post below containing analysis. In case of any error or you think you are not able to read the full post below, please email us at support#nehcap.com [lwa][/s2If] [s2If current_user_can(access_s2member_level1)]
- On Tuesday, the NZD/USD traded in the 0.6200 – 0.6155 range and consolidated itself above the 100-day SMA.
The pair currently trades last at 0.61615.
The previous day high was 0.6178 while the previous day low was 0.6137. The daily 38.2% Fib levels comes at 0.6162, expected to provide resistance. Similarly, the daily 61.8% fib level is at 0.6153, expected to provide support.
In Tuesday’s trading session, the NZD/USD experienced fluctuations within a range of 0.6200 to 0.6155, ultimately settling above the 100-day Simple Moving Average (SMA) at 0.6170. The market witnessed positive outcomes from Durable Goods and Housing Market data, while the Greenback strengthened as expectations of a more hawkish stance from the Federal Reserve increased.
In May, the Durable Goods Orders in the US showed a notable improvement, rising by 1.7% compared to the previous month’s 1.2% increase, exceeding the market consensus of -1%. Additionally, the New Home Sales for May experienced a substantial surge, surpassing expectations of a 0.5% change. This robust performance highlights the resilience of the housing market.
As a reaction, as robust economic data may allow the Federal Reserve (Fed) to continue hiking, US bond yields recovered on the day. The 2-year yield rose to 4.76% while the 5 and 10-year to 4.03% and 4.76%. That being said, the bond market could see further volatility on Wednesday, when investors will look for clues regarding the Fed’s next steps.
On the Kiwi’s side, investors will watch Retail Sales data, released at the early Asian session on Thursday, to get a clearer outlook of New Zealand’s economic outlook.
According to the daily chart, despite indicators turning somewhat flat, they still favour the NZD. In that sense, the Relative Strength (RSI) and Moving Average Convergence Divergence (MACD) hold in positive territory while the pair trades above the 200 and 20-day Simple Moving Averages (SMA).
On the upside, immediate resistance stands at the 100-day SMA, near the daily highs at 0.6200, followed by 0.6230 and 0.6250. On the downside, the 200 and 20-day SMAs act as the nearest support levels, at 0.6160 and 0.6135.
Technical Levels: Supports and Resistances
NZDUSD currently trading at 0.6166 at the time of writing. Pair opened at 0.6165 and is trading with a change of 0.02 % .
| Overview | Overview.1 | |
|---|---|---|
| 0 | Today last price | 0.6166 |
| 1 | Today Daily Change | 0.0001 |
| 2 | Today Daily Change % | 0.0200 |
| 3 | Today daily open | 0.6165 |
The pair is trading above its 20 Daily moving average @ 0.6129, below its 50 Daily moving average @ 0.6172 , below its 100 Daily moving average @ 0.6203 and above its 200 Daily moving average @ 0.6157
| Trends | Trends.1 | |
|---|---|---|
| 0 | Daily SMA20 | 0.6129 |
| 1 | Daily SMA50 | 0.6172 |
| 2 | Daily SMA100 | 0.6203 |
| 3 | Daily SMA200 | 0.6157 |
The previous day high was 0.6178 while the previous day low was 0.6137. The daily 38.2% Fib levels comes at 0.6162, expected to provide resistance. Similarly, the daily 61.8% fib level is at 0.6153, expected to provide support.
Note the levels of interest below:
- Pivot support is noted at 0.6142, 0.6119, 0.6101
- Pivot resistance is noted at 0.6183, 0.6201, 0.6224
| Levels | Levels.1 |
|---|---|
| Previous Daily High | 0.6178 |
| Previous Daily Low | 0.6137 |
| Previous Weekly High | 0.6237 |
| Previous Weekly Low | 0.6116 |
| Previous Monthly High | 0.6385 |
| Previous Monthly Low | 0.5985 |
| Daily Fibonacci 38.2% | 0.6162 |
| Daily Fibonacci 61.8% | 0.6153 |
| Daily Pivot Point S1 | 0.6142 |
| Daily Pivot Point S2 | 0.6119 |
| Daily Pivot Point S3 | 0.6101 |
| Daily Pivot Point R1 | 0.6183 |
| Daily Pivot Point R2 | 0.6201 |
| Daily Pivot Point R3 | 0.6224 |
[/s2If]
Nehcap Expert Advisor
The NEHCAP MT4 EA is high quality professional trading system geared to generate returns without using GRID or martingales. Each trade has strict risk per trade parameter. The pairs under management include EURUSD, GBPUSD, AUDCAD, AUDNZD,GBPAUD, EURAUD, EURCAD, CHFJPY and many more.
The system is trading live: LIVE ACCOUNT TRACKING
You can run it free. Apply for a free trial and track our account. Buy the system or use profit share mechanism to generate returns on your MT4.
Join Our Telegram Group
")


