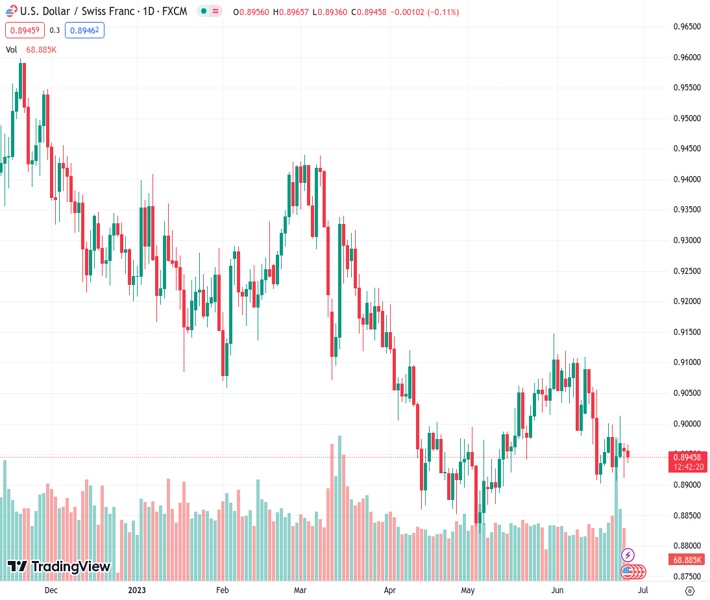
Investors have a conflicting view on the Federal Reserve’s monetary outlook, causing #USDCHF to fluctuate within a narrow range at a value of 0.89488.
…
This is a premium post.
[s2If !current_user_can(access_s2member_level4)]Please register for FREE REGISTER to read full post below containing analysis. In case of any error or you think you are not able to read the full post below, please email us at support#nehcap.com [lwa][/s2If] [s2If current_user_can(access_s2member_level1)]
- USD/CHF is trading back and forth in a limited range as investors are mixed about Fed’s monetary outlook.
The pair currently trades last at 0.89488.
The previous day high was 0.8979 while the previous day low was 0.8912. The daily 38.2% Fib levels comes at 0.8937, expected to provide support. Similarly, the daily 61.8% fib level is at 0.8953, expected to provide resistance.
The USD/CHF pair is showing topsy-turvy moves in a range of 0.8940-0.8960 in the European session. The Swiss Franc asset has turned non-directional amid uncertainty about the monetary policy outlook by the Federal Reserve (Fed).
S&P500 futures have surrendered some gains, however, the overall market mood is quite bullish as investors are shifting their focus from fears of global recession to the upcoming quarterly result season.
The US Dollar Index (DXY) is in a correction phase and has dropped to near 102.50. Investors should note that the downside momentum in the USD Index is weak, portraying that investors are awaiting a fresh trigger for further guidance.
USD/CHF is making efforts for keeping itself above the 61.8% Fibonacci retracement (plotted from May 04 low at 0.8820 to May 31 high at 0.9148) at 0.8946 on a four-hour scale. The 50-period Exponential Moving Average (EMA) at 0.8967 is acting as a barricade for the US Dollar bulls.
A range oscillation in the 40.00-60.00 territory by the Relative Strength Index (RSI) (14) indicates a sideways performance.
Going forward, a breakdown below May 12 low around 0.8900 would expose the Swiss Franc asset to April 13 low at 0.8860 followed by the ultimate support plotted from May 04 low at 0.8820.
In an alternate scenario, an upside move above the psychological resistance of 0.9000 would fade the bearish bias and will drive the asset toward June 06 low at 0.9033 and May 30 high at 0.9084.
Technical Levels: Supports and Resistances
USDCHF currently trading at 0.8944 at the time of writing. Pair opened at 0.8957 and is trading with a change of -0.15 % .
| Overview | Overview.1 | |
|---|---|---|
| 0 | Today last price | 0.8944 |
| 1 | Today Daily Change | -0.0013 |
| 2 | Today Daily Change % | -0.1500 |
| 3 | Today daily open | 0.8957 |
The pair remains strongly bearish on the daily time frame. It trades below the 20 SMA @ 0.9017, 50 SMA 0.8979, 100 SMA @ 0.9095 and 200 SMA @ 0.932.
| Trends | Trends.1 | |
|---|---|---|
| 0 | Daily SMA20 | 0.9017 |
| 1 | Daily SMA50 | 0.8979 |
| 2 | Daily SMA100 | 0.9095 |
| 3 | Daily SMA200 | 0.9320 |
The previous day high was 0.8979 while the previous day low was 0.8912. The daily 38.2% Fib levels comes at 0.8937, expected to provide support. Similarly, the daily 61.8% fib level is at 0.8953, expected to provide resistance.
Note the levels of interest below:
- Pivot support is noted at 0.892, 0.8882, 0.8852
- Pivot resistance is noted at 0.8987, 0.9017, 0.9054
| Levels | Levels.1 |
|---|---|
| Previous Daily High | 0.8979 |
| Previous Daily Low | 0.8912 |
| Previous Weekly High | 0.9013 |
| Previous Weekly Low | 0.8907 |
| Previous Monthly High | 0.9148 |
| Previous Monthly Low | 0.8820 |
| Daily Fibonacci 38.2% | 0.8937 |
| Daily Fibonacci 61.8% | 0.8953 |
| Daily Pivot Point S1 | 0.8920 |
| Daily Pivot Point S2 | 0.8882 |
| Daily Pivot Point S3 | 0.8852 |
| Daily Pivot Point R1 | 0.8987 |
| Daily Pivot Point R2 | 0.9017 |
| Daily Pivot Point R3 | 0.9054 |
[/s2If]
Nehcap Expert Advisor
The NEHCAP MT4 EA is high quality professional trading system geared to generate returns without using GRID or martingales. Each trade has strict risk per trade parameter. The pairs under management include EURUSD, GBPUSD, AUDCAD, AUDNZD,GBPAUD, EURAUD, EURCAD, CHFJPY and many more.
The system is trading live: LIVE ACCOUNT TRACKING
You can run it free. Apply for a free trial and track our account. Buy the system or use profit share mechanism to generate returns on your MT4.
Join Our Telegram Group
")


