Despite the US Durables outperforming expectations, the price of gold has successfully rebounded from $1,930.00 and currently sits at $1,926.96.
…
This is a premium post.
[s2If !current_user_can(access_s2member_level4)]Please register for FREE REGISTER to read full post below containing analysis. In case of any error or you think you are not able to read the full post below, please email us at support#nehcap.com [lwa][/s2If] [s2If current_user_can(access_s2member_level1)]
- Gold price has shown a confident recovery from $1,930.00 despite US Durables having outperformed consensus.
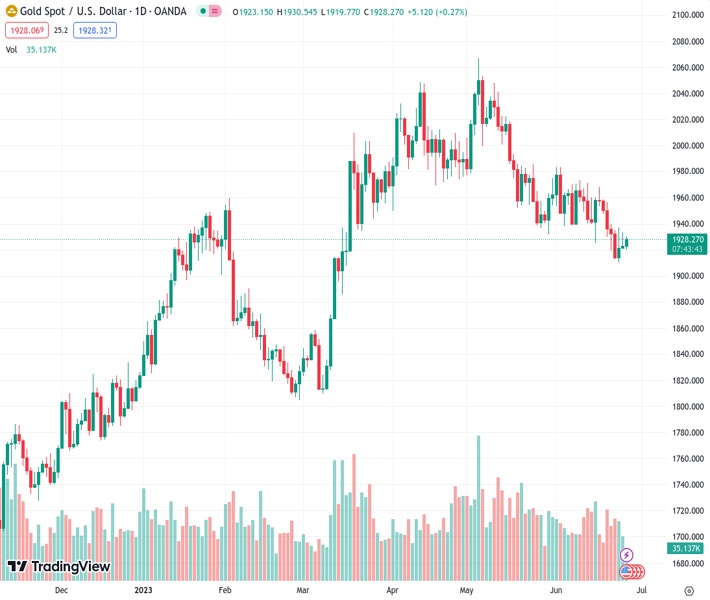
The pair currently trades last at 1926.96.
The previous day high was 1933.39 while the previous day low was 1920.8. The daily 38.2% Fib levels comes at 1928.58, expected to provide resistance. Similarly, the daily 61.8% fib level is at 1925.61, expected to provide support.
Gold price (XAU/USD) has displayed a recovery move from $1,920.00 in the early New York session. The precious metal has attracted significant bets despite the United States Durable Goods Orders data (May) having landed better than expectations.
US Census Bureau has reported that Durable Goods Orders have expanded by 1.7% while the street was anticipating a contraction of 1%. May’s Durables data has outperformed April’s figure of 1.2%. Durables data excluding defense orders have expanded by 3.0% against expectations of a stagnant performance. This indicates that demand for consumer durables was resilient and conveys that core inflation could turn out persistent further.
Upbeat US Durables data has propelled chances of one more interest rate hike by the Federal Reserve (Fed) for its July meeting. As per the CME Fedwatch tool, around 77% chances are in favor of a 25 basis point (bp) interest rate hike from the Fed for the July meeting.
Meanwhile, S&P500 futures have surrendered half of their gains amid a cautious market mood. The upcoming quarterly result season has kept investors on their toes.
The US Dollar Index (DXY) has extended its downside to near 102.40 despite fears of more interest rate hikes from the Fed. Fed chair Jerome Powell has confirmed that the central bank will continue tightening monetary policy but at a ‘careful pace’.
Gold price is attempting an upside break of the Symmetrical Triangle chart pattern formed on an hourly scale. An upside break will trigger an explosion in the volatility contraction, which will result in wider ticks and heavy volume.
The precious metal is trading below the 200-period Exponential Moving Average (EMA) at $1,934.50, which indicates that the long-term trend is bearish.
Meanwhile, the Relative Strength Index (RSI) (14) is oscillating in the 40.00-60.00 range, portraying a lackluster performance.
Technical Levels: Supports and Resistances
XAUUSD currently trading at 1926.27 at the time of writing. Pair opened at 1923.31 and is trading with a change of 0.15 % .
| Overview | Overview.1 | |
|---|---|---|
| 0 | Today last price | 1926.27 |
| 1 | Today Daily Change | 2.96 |
| 2 | Today Daily Change % | 0.15 |
| 3 | Today daily open | 1923.31 |
The pair is trading below its 20 Daily moving average @ 1948.84, below its 50 Daily moving average @ 1975.88 , below its 100 Daily moving average @ 1942.76 and above its 200 Daily moving average @ 1854.61
| Trends | Trends.1 | |
|---|---|---|
| 0 | Daily SMA20 | 1948.84 |
| 1 | Daily SMA50 | 1975.88 |
| 2 | Daily SMA100 | 1942.76 |
| 3 | Daily SMA200 | 1854.61 |
The previous day high was 1933.39 while the previous day low was 1920.8. The daily 38.2% Fib levels comes at 1928.58, expected to provide resistance. Similarly, the daily 61.8% fib level is at 1925.61, expected to provide support.
Note the levels of interest below:
- Pivot support is noted at 1918.28, 1913.24, 1905.69
- Pivot resistance is noted at 1930.87, 1938.42, 1943.46
| Levels | Levels.1 |
|---|---|
| Previous Daily High | 1933.39 |
| Previous Daily Low | 1920.80 |
| Previous Weekly High | 1958.85 |
| Previous Weekly Low | 1910.18 |
| Previous Monthly High | 2079.76 |
| Previous Monthly Low | 1932.12 |
| Daily Fibonacci 38.2% | 1928.58 |
| Daily Fibonacci 61.8% | 1925.61 |
| Daily Pivot Point S1 | 1918.28 |
| Daily Pivot Point S2 | 1913.24 |
| Daily Pivot Point S3 | 1905.69 |
| Daily Pivot Point R1 | 1930.87 |
| Daily Pivot Point R2 | 1938.42 |
| Daily Pivot Point R3 | 1943.46 |
[/s2If]
Nehcap Expert Advisor
The NEHCAP MT4 EA is high quality professional trading system geared to generate returns without using GRID or martingales. Each trade has strict risk per trade parameter. The pairs under management include EURUSD, GBPUSD, AUDCAD, AUDNZD,GBPAUD, EURAUD, EURCAD, CHFJPY and many more.
The system is trading live: LIVE ACCOUNT TRACKING
You can run it free. Apply for a free trial and track our account. Buy the system or use profit share mechanism to generate returns on your MT4.
Join Our Telegram Group
")


