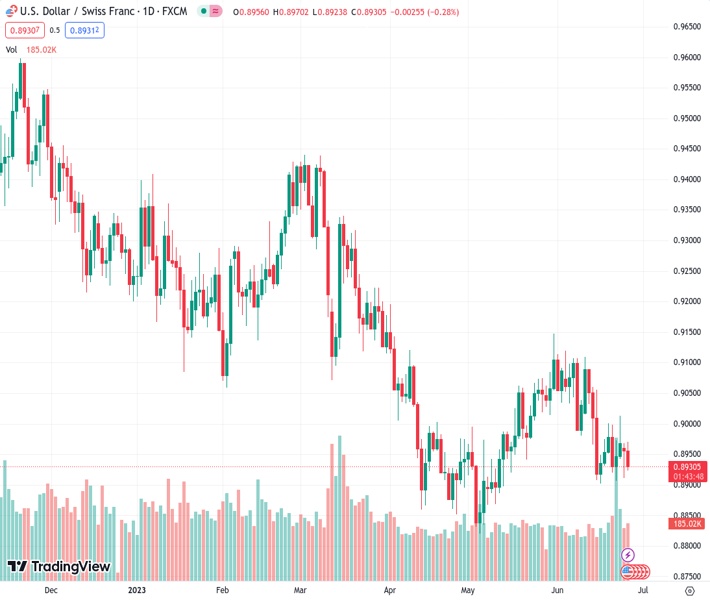
Despite a second-day decline, the USDCHF at 0.89319 remains above a significant support level.
…
This is a premium post.
[s2If !current_user_can(access_s2member_level4)]Please register for FREE REGISTER to read full post below containing analysis. In case of any error or you think you are not able to read the full post below, please email us at support#nehcap.com [lwa][/s2If] [s2If current_user_can(access_s2member_level1)]
- USD/CHF holds above crucial support despite the second-day drop
The pair currently trades last at 0.89319.
The previous day high was 0.8979 while the previous day low was 0.8912. The daily 38.2% Fib levels comes at 0.8937, expected to provide resistance. Similarly, the daily 61.8% fib level is at 0.8953, expected to provide resistance.
USD/CHF drops for the second straight day but remains above a one-month-old upslope support trendline amidst buyers’ failure to reclaim the 0.9000 figure on a risk-on mood environment. At the time of writing, the USD/CHF exchanges hands at 0.8933, losses 0.26% after reaching a daily high of 0.8970.
Although the USD/CHF remains downward biased in the short term, the downtrend remains suspect, as sellers couldn’t break below 0.8900 to test the year-to-date (YTD) low of 0.8819. That, alongside subsequent failure tests of USD/CHF sellers to surpass the 0.8920 area, formed a triple-bottom chart pattern, which warrants further upside.
If the above scenario plays out, the USD/CHF first resistance would be the 20-day Exponential Moving Average (EMA) at 0.8983, followed by the 50-day EMA at 0.9011. A breach of the latter, and the USD/CHF could rally towards the 100-day EMA at 0.9087 before challenging the 0.9100 figure.
Conversely, and the path of least resistance as oscillators remain in bearish territory, the USD/CHF first support would be 0.8920. Once cleared, the next support would be 0.8900, ahead of plunging toward the YTD low of 0.8819.
Technical Levels: Supports and Resistances
USDCHF currently trading at 0.8932 at the time of writing. Pair opened at 0.8957 and is trading with a change of -0.28 % .
| Overview | Overview.1 | |
|---|---|---|
| 0 | Today last price | 0.8932 |
| 1 | Today Daily Change | -0.0025 |
| 2 | Today Daily Change % | -0.2800 |
| 3 | Today daily open | 0.8957 |
The pair remains strongly bearish on the daily time frame. It trades below the 20 SMA @ 0.9017, 50 SMA 0.8979, 100 SMA @ 0.9095 and 200 SMA @ 0.932.
| Trends | Trends.1 | |
|---|---|---|
| 0 | Daily SMA20 | 0.9017 |
| 1 | Daily SMA50 | 0.8979 |
| 2 | Daily SMA100 | 0.9095 |
| 3 | Daily SMA200 | 0.9320 |
The previous day high was 0.8979 while the previous day low was 0.8912. The daily 38.2% Fib levels comes at 0.8937, expected to provide resistance. Similarly, the daily 61.8% fib level is at 0.8953, expected to provide resistance.
Note the levels of interest below:
- Pivot support is noted at 0.892, 0.8882, 0.8852
- Pivot resistance is noted at 0.8987, 0.9017, 0.9054
| Levels | Levels.1 |
|---|---|
| Previous Daily High | 0.8979 |
| Previous Daily Low | 0.8912 |
| Previous Weekly High | 0.9013 |
| Previous Weekly Low | 0.8907 |
| Previous Monthly High | 0.9148 |
| Previous Monthly Low | 0.8820 |
| Daily Fibonacci 38.2% | 0.8937 |
| Daily Fibonacci 61.8% | 0.8953 |
| Daily Pivot Point S1 | 0.8920 |
| Daily Pivot Point S2 | 0.8882 |
| Daily Pivot Point S3 | 0.8852 |
| Daily Pivot Point R1 | 0.8987 |
| Daily Pivot Point R2 | 0.9017 |
| Daily Pivot Point R3 | 0.9054 |
[/s2If]
Nehcap Expert Advisor
The NEHCAP MT4 EA is high quality professional trading system geared to generate returns without using GRID or martingales. Each trade has strict risk per trade parameter. The pairs under management include EURUSD, GBPUSD, AUDCAD, AUDNZD,GBPAUD, EURAUD, EURCAD, CHFJPY and many more.
The system is trading live: LIVE ACCOUNT TRACKING
You can run it free. Apply for a free trial and track our account. Buy the system or use profit share mechanism to generate returns on your MT4.
Join Our Telegram Group
")


