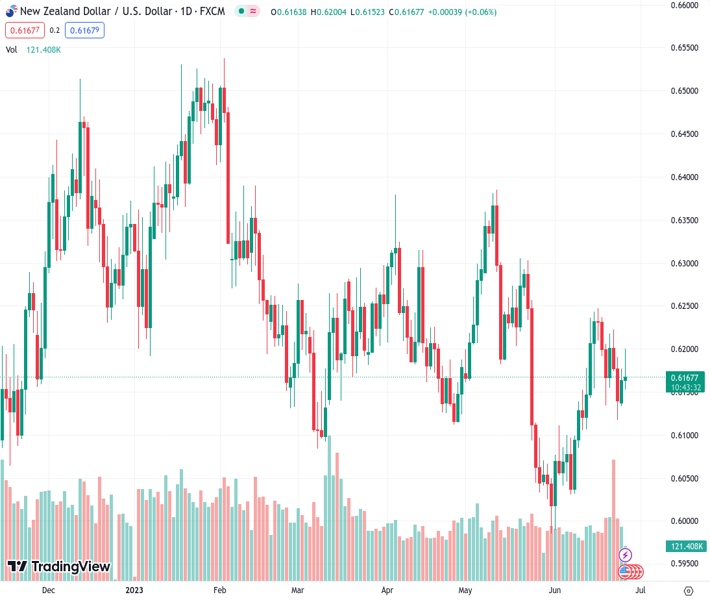
At the current rate of NZDUSD at 0.61680, there has been a detection of a desire to sell the currency around 0.6200 due to the intermediate support the US Dollar Index (DXY) has garnered.
…
This is a premium post.
[s2If !current_user_can(access_s2member_level4)]Please register for FREE REGISTER to read full post below containing analysis. In case of any error or you think you are not able to read the full post below, please email us at support#nehcap.com [lwa][/s2If] [s2If current_user_can(access_s2member_level1)]
- NZD/USD has sensed selling interest around 0.6200 as the US Dollar Index (DXY) has found intermediate support.
The pair currently trades last at 0.61680.
The previous day high was 0.6178 while the previous day low was 0.6137. The daily 38.2% Fib levels comes at 0.6162, expected to provide support. Similarly, the daily 61.8% fib level is at 0.6153, expected to provide support.
The NZD/USD pair has witnessed selling pressure while attempting to stretch the rally above the round-level resistance of 0.6200 in the London session. The Kiwi asset has dropped to near 0.6170 as the US Dollar Index (DXY) has shown stability after correcting to near 102.50.
S&P500 futures have trimmed gains added in early Europe as fears of global recession have elevated again. The commentary from European Central Bank (ECB) President Christine Lagarde that the current monetary policy is not sufficiently restrictive supports more interest rate hikes ahead.
Earlier, the New Zealand Dollar showed strength as investors are hoping that the Reserve Bank of New Zealand (RBNZ) will continue to raise interest rates as Kiwi inflation is extremely persistent.
NZD/USD is auctioning in a Falling Channel in which each pullback is considered a selling opportunity by the market participants. On a broader horizon, potential resistances are placed from May 19 high at 0.6306 and May 11 high at 0.6385.
The 200-period Exponential Moving Average (EMA) at 0.6160 is providing some cushion to the New Zealand Dollar.
Contrary to that, the Relative Strength Index (RSI) (14) is oscillating in the bearish range of 20.00-60.00.
A confident break above May 17 high at 0.6261 will drive the Kiwi asset toward May 19 high at 0.6306 followed by May 08 high around 0.6360.
Alternatively, a downside move below the June 16 low at 0.6116 will expose the asset to June 05 low at 0.6041. A slippage below the latter would expose the asset to psychological support at 0.6000.
Technical Levels: Supports and Resistances
NZDUSD currently trading at 0.6169 at the time of writing. Pair opened at 0.6165 and is trading with a change of 0.06 % .
| Overview | Overview.1 | |
|---|---|---|
| 0 | Today last price | 0.6169 |
| 1 | Today Daily Change | 0.0004 |
| 2 | Today Daily Change % | 0.0600 |
| 3 | Today daily open | 0.6165 |
The pair is trading above its 20 Daily moving average @ 0.6129, below its 50 Daily moving average @ 0.6172 , below its 100 Daily moving average @ 0.6203 and above its 200 Daily moving average @ 0.6157
| Trends | Trends.1 | |
|---|---|---|
| 0 | Daily SMA20 | 0.6129 |
| 1 | Daily SMA50 | 0.6172 |
| 2 | Daily SMA100 | 0.6203 |
| 3 | Daily SMA200 | 0.6157 |
The previous day high was 0.6178 while the previous day low was 0.6137. The daily 38.2% Fib levels comes at 0.6162, expected to provide support. Similarly, the daily 61.8% fib level is at 0.6153, expected to provide support.
Note the levels of interest below:
- Pivot support is noted at 0.6142, 0.6119, 0.6101
- Pivot resistance is noted at 0.6183, 0.6201, 0.6224
| Levels | Levels.1 |
|---|---|
| Previous Daily High | 0.6178 |
| Previous Daily Low | 0.6137 |
| Previous Weekly High | 0.6237 |
| Previous Weekly Low | 0.6116 |
| Previous Monthly High | 0.6385 |
| Previous Monthly Low | 0.5985 |
| Daily Fibonacci 38.2% | 0.6162 |
| Daily Fibonacci 61.8% | 0.6153 |
| Daily Pivot Point S1 | 0.6142 |
| Daily Pivot Point S2 | 0.6119 |
| Daily Pivot Point S3 | 0.6101 |
| Daily Pivot Point R1 | 0.6183 |
| Daily Pivot Point R2 | 0.6201 |
| Daily Pivot Point R3 | 0.6224 |
[/s2If]
Nehcap Expert Advisor
The NEHCAP MT4 EA is high quality professional trading system geared to generate returns without using GRID or martingales. Each trade has strict risk per trade parameter. The pairs under management include EURUSD, GBPUSD, AUDCAD, AUDNZD,GBPAUD, EURAUD, EURCAD, CHFJPY and many more.
The system is trading live: LIVE ACCOUNT TRACKING
You can run it free. Apply for a free trial and track our account. Buy the system or use profit share mechanism to generate returns on your MT4.
Join Our Telegram Group
")


