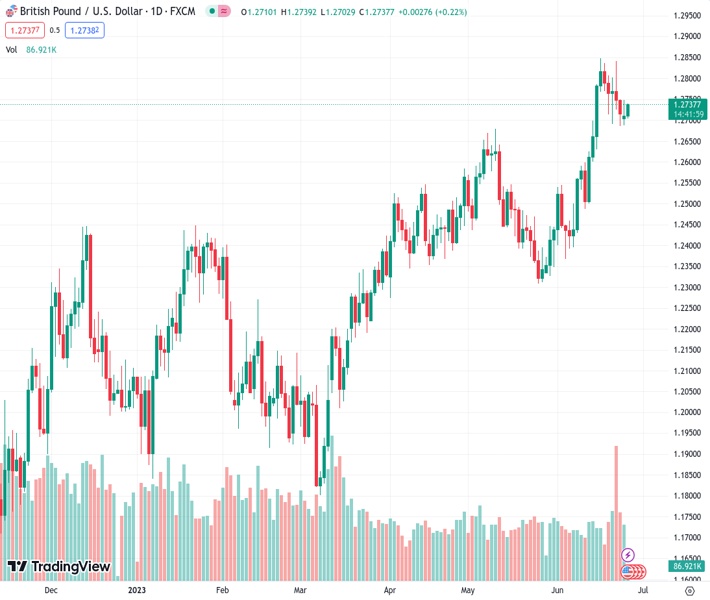
Although the market sentiment is positive, GBPUSD at 1.27360 is displaying indications of reduced volatility.
…
This is a premium post.
[s2If !current_user_can(access_s2member_level4)]Please register for FREE REGISTER to read full post below containing analysis. In case of any error or you think you are not able to read the full post below, please email us at support#nehcap.com [lwa][/s2If] [s2If current_user_can(access_s2member_level1)]
- GBP/USD is showing signs of volatility contraction despite the risk-on mood.
The pair currently trades last at 1.27360.
The previous day high was 1.2749 while the previous day low was 1.2688. The daily 38.2% Fib levels comes at 1.2711, expected to provide support. Similarly, the daily 61.8% fib level is at 1.2726, expected to provide support.
The GBP/USD pair is trading back and forth in a narrow range of 1.2700-1.2750 in the early London session. The upside in the Cable is restricted as higher inflationary pressures in the United Kingdom have dampened its economic outlook while the downside is supported due to correction in the US Dollar Index (DXY).
The US Dollar Index is hovering near 102.60 as investors are divided about the monetary outlook by the Federal Reserve (Fed). Fed chair Jerome Powell conveyed last week that the central bank will continue tightening interest rates but at a careful pace.
Going forward, the speech from Bank of England (BoE) Governor Andrew Bailey will remain in focus. BoE Bailey is expected to remain hawkish as UK’s core inflation has printed a fresh high of 7.1%.
GBP/USD delivered a steep fall after forming a Double Top chart pattern on an hourly scale around 1.2848. The Cable is showing signs of volatility contraction around 1.2750, which indicates non-directional performance but is followed by wider ticks and heavy volume after a breakout move.
The 200-period Exponential Moving Average (EMA) at 1.2723 has turned straight, portraying a lackluster performance.
Also, the Relative Strength Index (RSI) (14) is oscillating in a 40.00-60.00 range, which indicates that investors await a potential trigger for further action.
Bullish bias for the Cable would strengthen if it manages to climb above the fresh annual high around 1.2850. The upside move would expose the asset to 28 September 2020 high at 1.2930 followed by psychological resistance at 1.3000.
The bullish bias could fade if Cable drops below the previous month’s high around 1.2669, which would drag the asset toward June 12 high at 1.2600. A slippage below the latter would expose the asset to June 09 low at 1.2534.
Technical Levels: Supports and Resistances
GBPUSD currently trading at 1.273 at the time of writing. Pair opened at 1.2713 and is trading with a change of 0.13 % .
| Overview | Overview.1 | |
|---|---|---|
| 0 | Today last price | 1.2730 |
| 1 | Today Daily Change | 0.0017 |
| 2 | Today Daily Change % | 0.1300 |
| 3 | Today daily open | 1.2713 |
The pair remains strongly bullish on the daily timeframe. It trades above its 20 SMA @ 1.2608, 50 SMA 1.253, 100 SMA @ 1.2355 and 200 SMA @ 1.2082.
| Trends | Trends.1 | |
|---|---|---|
| 0 | Daily SMA20 | 1.2608 |
| 1 | Daily SMA50 | 1.2530 |
| 2 | Daily SMA100 | 1.2355 |
| 3 | Daily SMA200 | 1.2082 |
The previous day high was 1.2749 while the previous day low was 1.2688. The daily 38.2% Fib levels comes at 1.2711, expected to provide support. Similarly, the daily 61.8% fib level is at 1.2726, expected to provide support.
Note the levels of interest below:
- Pivot support is noted at 1.2684, 1.2656, 1.2624
- Pivot resistance is noted at 1.2745, 1.2777, 1.2806
| Levels | Levels.1 |
|---|---|
| Previous Daily High | 1.2749 |
| Previous Daily Low | 1.2688 |
| Previous Weekly High | 1.2845 |
| Previous Weekly Low | 1.2685 |
| Previous Monthly High | 1.2680 |
| Previous Monthly Low | 1.2308 |
| Daily Fibonacci 38.2% | 1.2711 |
| Daily Fibonacci 61.8% | 1.2726 |
| Daily Pivot Point S1 | 1.2684 |
| Daily Pivot Point S2 | 1.2656 |
| Daily Pivot Point S3 | 1.2624 |
| Daily Pivot Point R1 | 1.2745 |
| Daily Pivot Point R2 | 1.2777 |
| Daily Pivot Point R3 | 1.2806 |
[/s2If]
Nehcap Expert Advisor
The NEHCAP MT4 EA is high quality professional trading system geared to generate returns without using GRID or martingales. Each trade has strict risk per trade parameter. The pairs under management include EURUSD, GBPUSD, AUDCAD, AUDNZD,GBPAUD, EURAUD, EURCAD, CHFJPY and many more.
The system is trading live: LIVE ACCOUNT TRACKING
You can run it free. Apply for a free trial and track our account. Buy the system or use profit share mechanism to generate returns on your MT4.
Join Our Telegram Group
")


