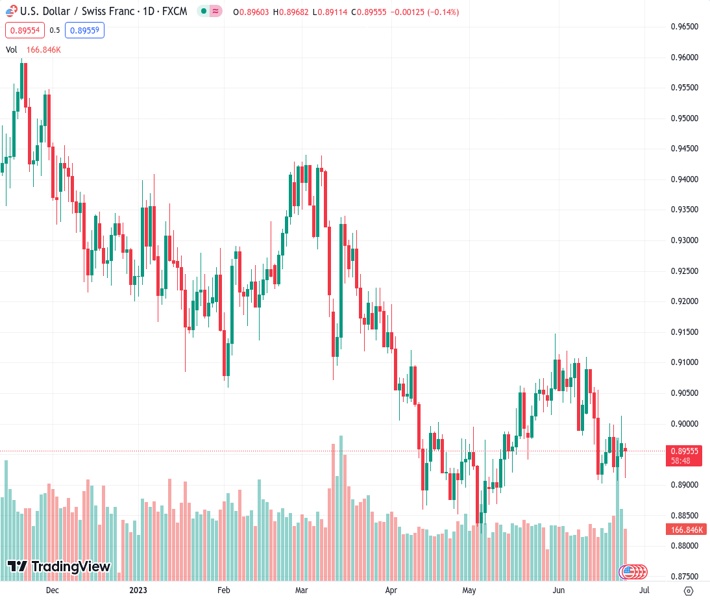
The USDCHF at a rate of 0.89540 is currently lingering around 0.8950 and is considering the possibility of surpassing the 20-day and 50-day EMA barriers at 0.8988 and 0.9014.
…
This is a premium post.
[s2If !current_user_can(access_s2member_level4)]Please register for FREE REGISTER to read full post below containing analysis. In case of any error or you think you are not able to read the full post below, please email us at support#nehcap.com [lwa][/s2If] [s2If current_user_can(access_s2member_level1)]
- USD/CHF hovers near 0.8950 and eyes 20-day and 50-day EMA resistance at 0.8988 and 0.9014.
The pair currently trades last at 0.89540.
The previous day high was 0.9013 while the previous day low was 0.8944. The daily 38.2% Fib levels comes at 0.8987, expected to provide resistance. Similarly, the daily 61.8% fib level is at 0.8971, expected to provide resistance.
USD/CHF trims some of its last Friday’s gains thought remains firm nearby 0.8950s after bouncing from daily lows reached early in the European session at around 0.8911. At the time of writing, the USD/CHF exchanges hands at 0.8952, down 0.17%, after failing to crack under the 0.8900 mark.
From a daily chart perspective, the USD/CHF remains neutral to downward biased but at the brisk of surpassing resistance levels like the 20 and 50-day Exponential Moving Averages (EMAs) at 0.8988 and 0.9014, respectively. Of note, the Relative Strength Index (RSI) indicator is closing into the 50-midline, which, once crossed, would trigger a buy signal. The three-day Rate of Change (RoC) depicts that buyers moved into the 0.8900 figure, as it prints its biggest gain, snapping three days of negative readings.
Therefore, the USD/CHF firsT resistance would be the 20-day EMA, followed by the 0.9000 figure. Break above will expose the 50-day EMA, followed by the 100-day EMA at 0.9090, ahead of 0.9100. On the flip side, the USD/CHF must break below 0.8900 for a bearish continuation, exposing the year-to-date (YTD) low of 0.8820, ahead of 0.8800.
Technical Levels: Supports and Resistances
USDCHF currently trading at 0.8956 at the time of writing. Pair opened at 0.8974 and is trading with a change of -0.2 % .
| Overview | Overview.1 | |
|---|---|---|
| 0 | Today last price | 0.8956 |
| 1 | Today Daily Change | -0.0018 |
| 2 | Today Daily Change % | -0.2000 |
| 3 | Today daily open | 0.8974 |
The pair remains strongly bearish on the daily time frame. It trades below the 20 SMA @ 0.9021, 50 SMA 0.898, 100 SMA @ 0.9098 and 200 SMA @ 0.9323.
| Trends | Trends.1 | |
|---|---|---|
| 0 | Daily SMA20 | 0.9021 |
| 1 | Daily SMA50 | 0.8980 |
| 2 | Daily SMA100 | 0.9098 |
| 3 | Daily SMA200 | 0.9323 |
The previous day high was 0.9013 while the previous day low was 0.8944. The daily 38.2% Fib levels comes at 0.8987, expected to provide resistance. Similarly, the daily 61.8% fib level is at 0.8971, expected to provide resistance.
Note the levels of interest below:
- Pivot support is noted at 0.8941, 0.8908, 0.8872
- Pivot resistance is noted at 0.901, 0.9046, 0.9078
| Levels | Levels.1 |
|---|---|
| Previous Daily High | 0.9013 |
| Previous Daily Low | 0.8944 |
| Previous Weekly High | 0.9013 |
| Previous Weekly Low | 0.8907 |
| Previous Monthly High | 0.9148 |
| Previous Monthly Low | 0.8820 |
| Daily Fibonacci 38.2% | 0.8987 |
| Daily Fibonacci 61.8% | 0.8971 |
| Daily Pivot Point S1 | 0.8941 |
| Daily Pivot Point S2 | 0.8908 |
| Daily Pivot Point S3 | 0.8872 |
| Daily Pivot Point R1 | 0.9010 |
| Daily Pivot Point R2 | 0.9046 |
| Daily Pivot Point R3 | 0.9078 |
[/s2If]
Nehcap Expert Advisor
The NEHCAP MT4 EA is high quality professional trading system geared to generate returns without using GRID or martingales. Each trade has strict risk per trade parameter. The pairs under management include EURUSD, GBPUSD, AUDCAD, AUDNZD,GBPAUD, EURAUD, EURCAD, CHFJPY and many more.
The system is trading live: LIVE ACCOUNT TRACKING
You can run it free. Apply for a free trial and track our account. Buy the system or use profit share mechanism to generate returns on your MT4.
Join Our Telegram Group
")


