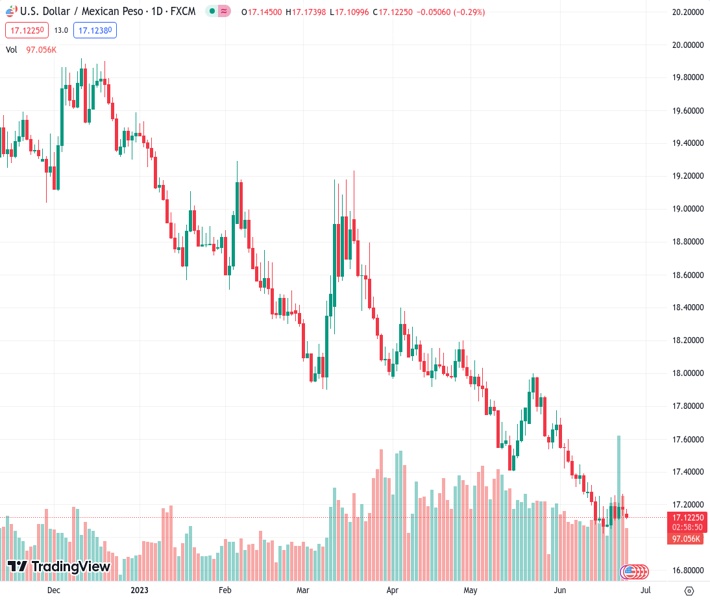
The USD/MXN has decreased in value to 17.1225 following Banxico’s decision to maintain interest rates despite worries about the global economy.
…
This is a premium post.
[s2If !current_user_can(access_s2member_level4)]Please register for FREE REGISTER to read full post below containing analysis. In case of any error or you think you are not able to read the full post below, please email us at support#nehcap.com [lwa][/s2If] [s2If current_user_can(access_s2member_level1)]
- USD/MXN dips as Banxico holds rates steady, despite global economic concerns.
The pair currently trades last at 17.1225.
The previous day high was 17.2656 while the previous day low was 17.1367. The daily 38.2% Fib levels comes at 17.186, expected to provide resistance. Similarly, the daily 61.8% fib level is at 17.2164, expected to provide resistance.
USD/MXN extend its losses toward last Friday’s daily low of 17.1308 after last Thursday’s Bank of Mexico (Banxico) monetary policy decision to hold rates unchanged at 11.25%, its second pause after May’s decision. A risk-off impulse was no excuse for the Mexican Peso (MXN) to continue its strong advance against the US Dollar (USD). At the time of writing, the USD/MXN is trading at 17.1363, down 0.21%.
Wall Street remains trading negatively. Risk aversion is the primary driver of the markets amidst a light economic calendar in the United States (US). The Dallas Fed Manufacturing Index for June contracted to -23.2, above estimates, yet still in recessionary territory, portraying an economic slowdown. Even though it contracted, it improved the most in the last three months.
Meanwhile, market participants lowered their bets for a possible rate cut by the US Federal Reserve (Fed), as shown by the CME Fed Watch Tool, after Fed officials revised the Federal Funds Rate (FFR) peak to 5.6%. Nevertheless, money market futures do not believe the Fed will raise rates twice, with only one 25 bps increase, toward the end of the year.
That helped the Mexican Peso (MXN) to prolong its appreciation, despite developments in Russia, with the Russian private group Wagner set to enter Moscow amid an ongoing disagreement with Russian commanders, which according to Yevgeny Prigozhin, the leader of the group, botched Russia’s military campaign in Ukraine.
The US Dollar Index (DXY) tracks the performance of six currencies vs. the American Dollar (USD), which tumbled 0.12%, down to 102.737, undermined by falling US Treasury bond yields.
Across the border, last week’s Banxico decision did not help USD/MXN buyers, as the pair halted its rally and made a U-turn at around 17.2644. Monday-s Mexican agenda featured General Economic Activity in May rose by 2.5%, exceeding estimates of 2.3%, according to Reuters. Meanwhile, month-over-month (MoM) readings rose by 0.8%, exceeding March’s contraction of -0.2%.
The USD/MXN is downward biased, set to continue to fall at around the 17.00 figure. As the 20-day Exponential Moving Average (EMA) emerged around 17.2897, further continuation is expected below 17.1000. A breach of the latter will expose the year-to-date (TD) low of 17.0219 before surpassing the 17.00 handle. On the flip side, if USD/MXN buyers claim the 20-day EMA, that could lift the USD/MXN spot price higher, at least to the 50-day EMA at 17.5799.
Technical Levels: Supports and Resistances
USDMXN currently trading at 17.1253 at the time of writing. Pair opened at 17.1791 and is trading with a change of -0.31 % .
| Overview | Overview.1 | |
|---|---|---|
| 0 | Today last price | 17.1253 |
| 1 | Today Daily Change | -0.0538 |
| 2 | Today Daily Change % | -0.3100 |
| 3 | Today daily open | 17.1791 |
The pair remains strongly bearish on the daily time frame. It trades below the 20 SMA @ 17.3255, 50 SMA 17.6375, 100 SMA @ 18.0195 and 200 SMA @ 18.776.
| Trends | Trends.1 | |
|---|---|---|
| 0 | Daily SMA20 | 17.3255 |
| 1 | Daily SMA50 | 17.6375 |
| 2 | Daily SMA100 | 18.0195 |
| 3 | Daily SMA200 | 18.7760 |
The previous day high was 17.2656 while the previous day low was 17.1367. The daily 38.2% Fib levels comes at 17.186, expected to provide resistance. Similarly, the daily 61.8% fib level is at 17.2164, expected to provide resistance.
Note the levels of interest below:
- Pivot support is noted at 17.122, 17.0649, 16.9932
- Pivot resistance is noted at 17.2509, 17.3227, 17.3798
| Levels | Levels.1 |
|---|---|
| Previous Daily High | 17.2656 |
| Previous Daily Low | 17.1367 |
| Previous Weekly High | 17.2656 |
| Previous Weekly Low | 17.0610 |
| Previous Monthly High | 18.0780 |
| Previous Monthly Low | 17.4203 |
| Daily Fibonacci 38.2% | 17.1860 |
| Daily Fibonacci 61.8% | 17.2164 |
| Daily Pivot Point S1 | 17.1220 |
| Daily Pivot Point S2 | 17.0649 |
| Daily Pivot Point S3 | 16.9932 |
| Daily Pivot Point R1 | 17.2509 |
| Daily Pivot Point R2 | 17.3227 |
| Daily Pivot Point R3 | 17.3798 |
[/s2If]
Nehcap Expert Advisor
The NEHCAP MT4 EA is high quality professional trading system geared to generate returns without using GRID or martingales. Each trade has strict risk per trade parameter. The pairs under management include EURUSD, GBPUSD, AUDCAD, AUDNZD,GBPAUD, EURAUD, EURCAD, CHFJPY and many more.
The system is trading live: LIVE ACCOUNT TRACKING
You can run it free. Apply for a free trial and track our account. Buy the system or use profit share mechanism to generate returns on your MT4.
Join Our Telegram Group
")


