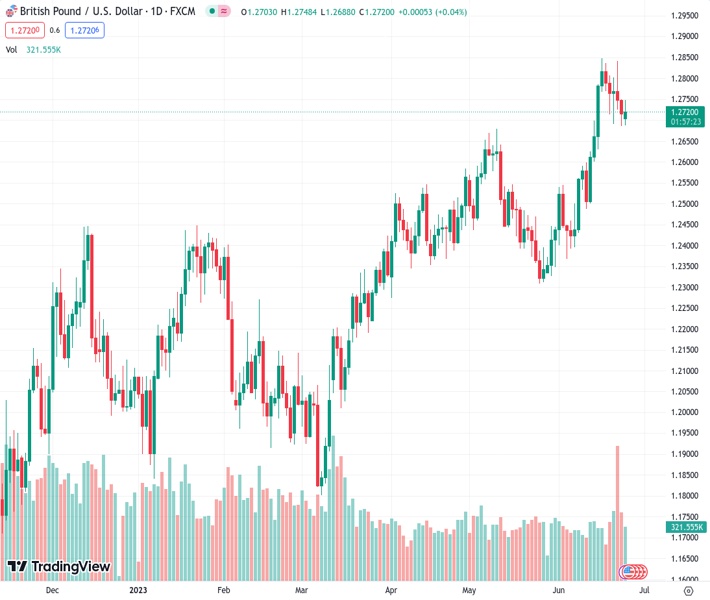
The GBPUSD exchange rate has exceeded the 1.2700 level due to a decline in the strength of the USD and a preference for safe investments.
…
This is a premium post.
[s2If !current_user_can(access_s2member_level4)]Please register for FREE REGISTER to read full post below containing analysis. In case of any error or you think you are not able to read the full post below, please email us at support#nehcap.com [lwa][/s2If] [s2If current_user_can(access_s2member_level1)]
- GBP/USD surpasses 1.2700 mark amidst broad USD weakness and risk aversion.
The pair currently trades last at 1.27209.
The previous day high was 1.2752 while the previous day low was 1.2685. The daily 38.2% Fib levels comes at 1.2711, expected to provide support. Similarly, the daily 61.8% fib level is at 1.2727, expected to provide resistance.
GBP/USD climbs after dropping to a last week’s low of 1.2685, surpassing the 1.2700 figure amidst a risk-off impulse and broad US Dollar (USD) weakness across the board. The previous week’s Bank of England (BoE) 50 bps rate hike weakened the Pound Sterling (GBP) on fears that higher rates could spur a recession in the UK. Nevertheless, the GBP/USD clings to its 0.03% gains, trading at 1.2718.
The GBP/USD is clinging to its gains as the greenback weakens on risk aversion. A light economic calendar in the United States (US) left traders adrift to last week’s data and Fed speakers hitting the wires during the weekend. The New York Fed President John Williams noted that “restoring price stability is of paramount importance because it is the foundation of sustained economic and financial stability. Price stability is not an either/or, it’s a must have.”
In the early morning, the Dallas Fed Manufacturing Index for June came at -23.2, exceeding forecasts yet still in recessionary territory, portraying a US economic slowdown. Even though it contracted, it improved the most in the last three months.
Market participants mainly ignored the data, as the GBP/USD reaction was muted. Speculators slashed their bets for a Federal Reserve (Fed) rate cut in 2023; they expect a 25 bps rate hike through the remainder of 2023, according to CME FedWatch Tool data. Policymakers revised the Federal Funds Rate (FFR) above 5.50%, but investors do not believe the Fed would surpass 5.50%, as shown by the swaps market.
The US Dollar Index (DXY), which measures the performance of six currencies vs. the American Dollar (USD), slides 0.17%, down to 102.696, undermined by falling US Treasury bond yields.
Across the pond, the UK economic calendar was absent, though a Reuters poll showed investors expect the Bank of England (BoE) to increase borrowing costs by 50 basis points towards the end of 2023. The latest week’s inflation data in the UK opened the door for a surprising 50 bps rate hike by the BoE while increasing the odds for further tightening amidst stubbornly high inflation.
Even though a rate hike will usually appreciate the currency of a country that raised borrowing costs, in the UK happened, the opposite as the economy continues to deteriorate and mortgage rates rose. That spurred fears the UK’s economy would be tipped into a recession. Therefore, speculators piled in a sold the GBP/USD.
From a technical perspective, the GBP/USD remains upward biased, but to continue its uptrend, buyers must achieve a daily close above the June 23 high of 1.2749. In that outcome, the GBP/USD could extend its gains past 1.2800 and re-test the year-to-date (YTD) high of 1.2748. Conversely, that will exacerbate the GBP/USD fall toward the 1.2600 handle, exposing the 20-day Exponential Moving Average (EMA) at 1.2641 as the first resistance. Breach or the latter will expose the psychological 1.2600 figure.
Technical Levels: Supports and Resistances
GBPUSD currently trading at 1.2722 at the time of writing. Pair opened at 1.2716 and is trading with a change of 0.05 % .
| Overview | Overview.1 | |
|---|---|---|
| 0 | Today last price | 1.2722 |
| 1 | Today Daily Change | 0.0006 |
| 2 | Today Daily Change % | 0.0500 |
| 3 | Today daily open | 1.2716 |
The pair remains strongly bullish on the daily timeframe. It trades above its 20 SMA @ 1.259, 50 SMA 1.2523, 100 SMA @ 1.2348 and 200 SMA @ 1.2076.
| Trends | Trends.1 | |
|---|---|---|
| 0 | Daily SMA20 | 1.2590 |
| 1 | Daily SMA50 | 1.2523 |
| 2 | Daily SMA100 | 1.2348 |
| 3 | Daily SMA200 | 1.2076 |
The previous day high was 1.2752 while the previous day low was 1.2685. The daily 38.2% Fib levels comes at 1.2711, expected to provide support. Similarly, the daily 61.8% fib level is at 1.2727, expected to provide resistance.
Note the levels of interest below:
- Pivot support is noted at 1.2683, 1.265, 1.2616
- Pivot resistance is noted at 1.275, 1.2785, 1.2818
| Levels | Levels.1 |
|---|---|
| Previous Daily High | 1.2752 |
| Previous Daily Low | 1.2685 |
| Previous Weekly High | 1.2845 |
| Previous Weekly Low | 1.2685 |
| Previous Monthly High | 1.2680 |
| Previous Monthly Low | 1.2308 |
| Daily Fibonacci 38.2% | 1.2711 |
| Daily Fibonacci 61.8% | 1.2727 |
| Daily Pivot Point S1 | 1.2683 |
| Daily Pivot Point S2 | 1.2650 |
| Daily Pivot Point S3 | 1.2616 |
| Daily Pivot Point R1 | 1.2750 |
| Daily Pivot Point R2 | 1.2785 |
| Daily Pivot Point R3 | 1.2818 |
[/s2If]
Nehcap Expert Advisor
The NEHCAP MT4 EA is high quality professional trading system geared to generate returns without using GRID or martingales. Each trade has strict risk per trade parameter. The pairs under management include EURUSD, GBPUSD, AUDCAD, AUDNZD,GBPAUD, EURAUD, EURCAD, CHFJPY and many more.
The system is trading live: LIVE ACCOUNT TRACKING
You can run it free. Apply for a free trial and track our account. Buy the system or use profit share mechanism to generate returns on your MT4.
Join Our Telegram Group
")


