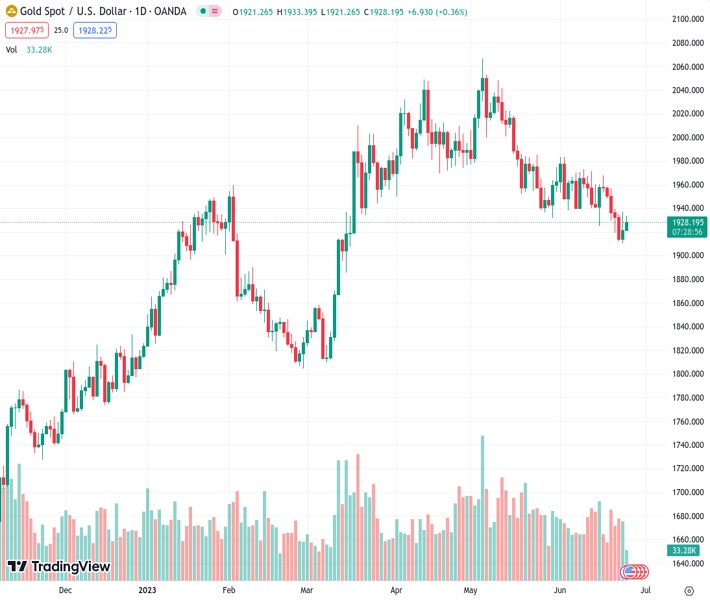
The current value of gold is at 1,928.04 USD per troy ounce and it is seeking stability above 1,930.00 USD due to a depreciation of the USD Index.
…
This is a premium post.
[s2If !current_user_can(access_s2member_level4)]Please register for FREE REGISTER to read full post below containing analysis. In case of any error or you think you are not able to read the full post below, please email us at support#nehcap.com [lwa][/s2If] [s2If current_user_can(access_s2member_level1)]
- Gold price is looking for stabilization above $1,930.00 amid a sell-off in the USD Index.
The pair currently trades last at 1928.04.
The previous day high was 1937.45 while the previous day low was 1910.18. The daily 38.2% Fib levels comes at 1927.03, expected to provide support. Similarly, the daily 61.8% fib level is at 1920.6, expected to provide support.
Gold price (XAU/USD) has climbed marginally above the crucial resistance of $1,930.00 in the London session. The precious metal is looking for stability above $1,930.00 as the US Dollar Index (DXY) is facing pressure. The USD Index has corrected to near 102.63 as the investing community is mixed about further monetary policy by the Fed.
S&P500 futures have recovered the majority of losses, portraying a recovery in the risk appetite of the market participants. US 500 basket is expected to open on a cautious note as investors are worried about the quarterly result season, which will kick-start sooner.
The yellow metal is also showing some resilience due to severe correction in the US Treasury yields. The 10-year US Treasury yields have dropped sharply to near 3.68%. Analysts at Rabobank expect the Fed to hike in July, a more moderate pace would imply skipping September and that would leave us with November as the meeting for the second hike.
The street will keep the focus on the labor market and inflation data for June as further resilience would propel the need for more restrictive monetary policy. Going forward, US Durables Goods Orders data will remain in the spotlight.
Gold price is approaching the upper portion of the Falling Channel chart pattern on a two-hour scale in which each pullback is considered as a selling opportunity by the market participants. Horizontal resistance is plotted from May 05 low around $2,000.00.
The Relative Strength Index (RSI) (14) is widely oscillating in the bearish range of 20.00-60.00 in which an oscillation near 60.00 would trigger gold sellers.
Technical Levels: Supports and Resistances
XAUUSD currently trading at 1930.03 at the time of writing. Pair opened at 1920.8 and is trading with a change of 0.48 % .
| Overview | Overview.1 | |
|---|---|---|
| 0 | Today last price | 1930.03 |
| 1 | Today Daily Change | 9.23 |
| 2 | Today Daily Change % | 0.48 |
| 3 | Today daily open | 1920.80 |
The pair is trading below its 20 Daily moving average @ 1949.86, below its 50 Daily moving average @ 1977.31 , below its 100 Daily moving average @ 1942.17 and above its 200 Daily moving average @ 1853.37
| Trends | Trends.1 | |
|---|---|---|
| 0 | Daily SMA20 | 1949.86 |
| 1 | Daily SMA50 | 1977.31 |
| 2 | Daily SMA100 | 1942.17 |
| 3 | Daily SMA200 | 1853.37 |
The previous day high was 1937.45 while the previous day low was 1910.18. The daily 38.2% Fib levels comes at 1927.03, expected to provide support. Similarly, the daily 61.8% fib level is at 1920.6, expected to provide support.
Note the levels of interest below:
- Pivot support is noted at 1908.17, 1895.54, 1880.9
- Pivot resistance is noted at 1935.44, 1950.08, 1962.71
| Levels | Levels.1 |
|---|---|
| Previous Daily High | 1937.45 |
| Previous Daily Low | 1910.18 |
| Previous Weekly High | 1958.85 |
| Previous Weekly Low | 1910.18 |
| Previous Monthly High | 2079.76 |
| Previous Monthly Low | 1932.12 |
| Daily Fibonacci 38.2% | 1927.03 |
| Daily Fibonacci 61.8% | 1920.60 |
| Daily Pivot Point S1 | 1908.17 |
| Daily Pivot Point S2 | 1895.54 |
| Daily Pivot Point S3 | 1880.90 |
| Daily Pivot Point R1 | 1935.44 |
| Daily Pivot Point R2 | 1950.08 |
| Daily Pivot Point R3 | 1962.71 |
[/s2If]
Nehcap Expert Advisor
The NEHCAP MT4 EA is high quality professional trading system geared to generate returns without using GRID or martingales. Each trade has strict risk per trade parameter. The pairs under management include EURUSD, GBPUSD, AUDCAD, AUDNZD,GBPAUD, EURAUD, EURCAD, CHFJPY and many more.
The system is trading live: LIVE ACCOUNT TRACKING
You can run it free. Apply for a free trial and track our account. Buy the system or use profit share mechanism to generate returns on your MT4.
Join Our Telegram Group
")


