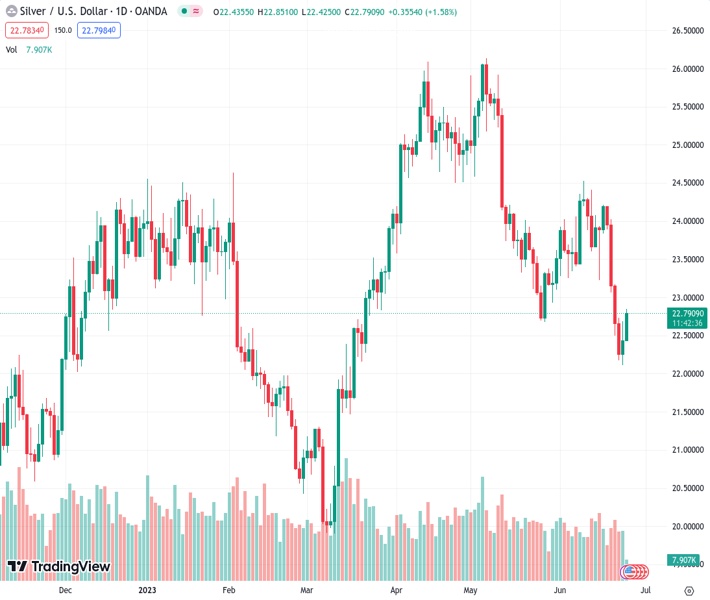
Silver has experienced a strong surge for a second consecutive day and has continued to climb back up from a low point that lasted several months. The current value of #XAGUSD is at 22.788.
…
This is a premium post.
[s2If !current_user_can(access_s2member_level4)]Please register for FREE REGISTER to read full post below containing analysis. In case of any error or you think you are not able to read the full post below, please email us at support#nehcap.com [lwa][/s2If] [s2If current_user_can(access_s2member_level1)]
- Silver gains strong traction for the second straight day and recovers further from a multi-month low.
The pair currently trades last at 22.788.
The previous day high was 22.68 while the previous day low was 22.11. The daily 38.2% Fib levels comes at 22.47, expected to provide support. Similarly, the daily 61.8% fib level is at 22.33, expected to provide support.
Silver builds on Friday’s modest bounce from the $22.10 area, or its lowest level since March 17 and gains strong follow-through traction on the first day of a new week. The upward trajectory remains unabated through the early part of the European session and lifts the white metal to a three-day high, around the $22.85 region in the last hour.
From a technical perspective, the XAG/USD has now moved back above the 100-hour Simple Moving Average (SMA) and is currently placed around the 38.2% Fibonacci retracement level of the downfall witnessed over the past week or so. A sustained strength beyond might trigger a fresh bout of a short-covering rally and lift the commodity beyond the $23.00 mark, towards testing the 50% Fibo. level, around the $23.15 region.
The recovery could get extended to the $23.35-$23.40 confluence, comprising the 200-hour SMA and the 61.8% Fibo. level, which should now act as a pivotal point. Given that oscillators on the daily chart are still holding in the negative territory, bulls might wait for some follow-through buying beyond the said barrier before confirming that the XAG/USD has formed a bottom ahead of the $22.00 mark and positioning for any further gains.
On the flip side, weakness back below the 23.6% Fibo. level, around the $22.60 area, will expose the multi-month low, around the $22.10 region. Some follow-through selling below the $22.00 mark will be seen as a fresh trigger for bearish traders and make the XAG/USD accelerate the slide towards the $21.70-$21.65 support zone. The downward trajectory could get extended further towards the $21.25 support en route to the $21.00 round figure.
The next relevant support is pegged near the $20.50 area, below which the XAG/USD might eventually aim towards challenging the YTD low, levels just below the $20.00 psychological mark touched in March.
Technical Levels: Supports and Resistances
XAGUSD currently trading at 22.79 at the time of writing. Pair opened at 22.44 and is trading with a change of 1.56 % .
| Overview | Overview.1 | |
|---|---|---|
| 0 | Today last price | 22.79 |
| 1 | Today Daily Change | 0.35 |
| 2 | Today Daily Change % | 1.56 |
| 3 | Today daily open | 22.44 |
The pair is trading below its 20 Daily moving average @ 23.54, below its 50 Daily moving average @ 24.19 , below its 100 Daily moving average @ 23.32 and above its 200 Daily moving average @ 22.49
| Trends | Trends.1 | |
|---|---|---|
| 0 | Daily SMA20 | 23.54 |
| 1 | Daily SMA50 | 24.19 |
| 2 | Daily SMA100 | 23.32 |
| 3 | Daily SMA200 | 22.49 |
The previous day high was 22.68 while the previous day low was 22.11. The daily 38.2% Fib levels comes at 22.47, expected to provide support. Similarly, the daily 61.8% fib level is at 22.33, expected to provide support.
Note the levels of interest below:
- Pivot support is noted at 22.14, 21.84, 21.57
- Pivot resistance is noted at 22.71, 22.98, 23.28
| Levels | Levels.1 |
|---|---|
| Previous Daily High | 22.68 |
| Previous Daily Low | 22.11 |
| Previous Weekly High | 24.20 |
| Previous Weekly Low | 22.11 |
| Previous Monthly High | 26.14 |
| Previous Monthly Low | 22.68 |
| Daily Fibonacci 38.2% | 22.47 |
| Daily Fibonacci 61.8% | 22.33 |
| Daily Pivot Point S1 | 22.14 |
| Daily Pivot Point S2 | 21.84 |
| Daily Pivot Point S3 | 21.57 |
| Daily Pivot Point R1 | 22.71 |
| Daily Pivot Point R2 | 22.98 |
| Daily Pivot Point R3 | 23.28 |
[/s2If]
Nehcap Expert Advisor
The NEHCAP MT4 EA is high quality professional trading system geared to generate returns without using GRID or martingales. Each trade has strict risk per trade parameter. The pairs under management include EURUSD, GBPUSD, AUDCAD, AUDNZD,GBPAUD, EURAUD, EURCAD, CHFJPY and many more.
The system is trading live: LIVE ACCOUNT TRACKING
You can run it free. Apply for a free trial and track our account. Buy the system or use profit share mechanism to generate returns on your MT4.
Join Our Telegram Group
")


