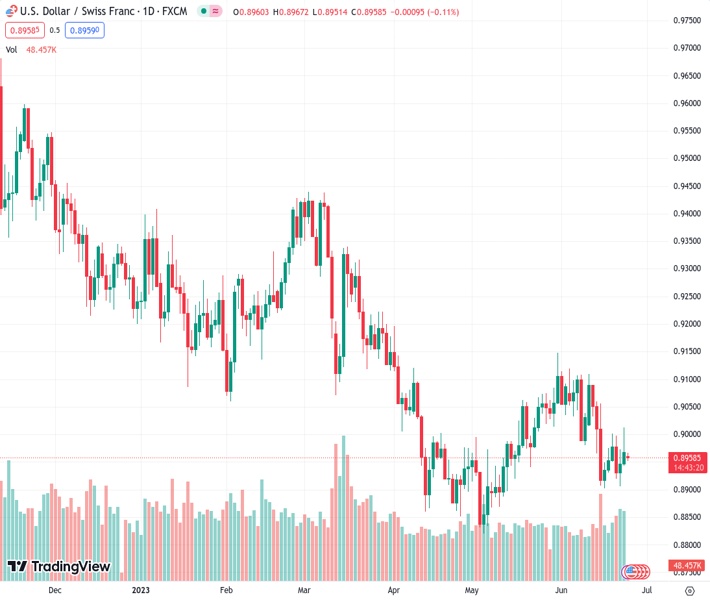
During the first day of decline in three days, #USDCHF @ 0.89561 still holds on to slight losses.
…
This is a premium post.
[s2If !current_user_can(access_s2member_level4)]Please register for FREE REGISTER to read full post below containing analysis. In case of any error or you think you are not able to read the full post below, please email us at support#nehcap.com [lwa][/s2If] [s2If current_user_can(access_s2member_level1)]
- USD/CHF clings to mild losses during the first negative day in three.
The pair currently trades last at 0.89561.
The previous day high was 0.9013 while the previous day low was 0.8944. The daily 38.2% Fib levels comes at 0.8987, expected to provide resistance. Similarly, the daily 61.8% fib level is at 0.8971, expected to provide resistance.
USD/CHF holds lower grounds at the intraday bottom surrounding 0.8950 as bears defend the first daily loss in three heading into Monday’s European session. In doing so, the Swiss Franc (CHF) pair sellers cheer the broad US Dollar retreat amid cautiously optimistic markets.
US Dollar Index (DXY) pares the first weekly gain in four around 102.70 as it bears the burden of mild optimism surrounding China and receding geopolitical fears from Russia. Furthermore, consolidation ahead of this week’s US inflation clues and central bankers’ speeches also exerts downside pressure on the DXY.
That said, the weekend headlines suggesting sooner China stimulus join doubts about Russian President Vladimir Putin’s power in Moscow to underpin mildly positive sentiment. Alternatively, S&P’s recent downbeat China GDP forecasts and hawkish Fed concerns prod the market’s risk-on mood.
It should be noted that Fed Chair Jerome Powell’s testimony during the previous week renewed hawkish bias about the US Federal Reserve’s (Fed) move. On the same line were upbeat US PMIs and comments favoring two rate hikes from Federal Reserve Bank of San Francisco President Mary Daly.
Alternatively, Swiss National Bank (SNB) Chairman Thomas Jordan said in an interview aired by Swiss broadcaster SRF on Saturday, per Reuters, that SNB’s recent interest rate hike was ‘very likely not quite’ enough to get a grip on inflation in Switzerland.
Against this backdrop, the S&P500 Futures rebound from the lowest levels in a week toward regaining the 4,400 round figure, up 0.20% intraday near 4,398 at the latest. That said, the US 10-year Treasury bond yields remain sidelined near 3.73%, after snapping a two-week downtrend, whereas the two-year counterpart braces for the fourth consecutive weekly winning streak near 4.74% by the press time.
Looking ahead, a light calendar in India emphasizes the US inflation data and the speeches of the top-tier central bankers at the European Central Bank (ECB) Forum as the key catalysts.
USD/CHF extends the previous day’s U-turn from a two-week-old descending resistance line, around 0.9010 by the press time. Additionally favoring the Swiss France buyers past 0.9010 is the 200-Hour Moving Average (HMA), close to 0.8970, as well as the bearish MACD signals.
Technical Levels: Supports and Resistances
USDCHF currently trading at 0.8957 at the time of writing. Pair opened at 0.8974 and is trading with a change of -0.19% % .
| Overview | Overview.1 | |
|---|---|---|
| 0 | Today last price | 0.8957 |
| 1 | Today Daily Change | -0.0017 |
| 2 | Today Daily Change % | -0.19% |
| 3 | Today daily open | 0.8974 |
The pair remains strongly bearish on the daily time frame. It trades below the 20 SMA @ 0.9021, 50 SMA 0.898, 100 SMA @ 0.9098 and 200 SMA @ 0.9323.
| Trends | Trends.1 | |
|---|---|---|
| 0 | Daily SMA20 | 0.9021 |
| 1 | Daily SMA50 | 0.8980 |
| 2 | Daily SMA100 | 0.9098 |
| 3 | Daily SMA200 | 0.9323 |
The previous day high was 0.9013 while the previous day low was 0.8944. The daily 38.2% Fib levels comes at 0.8987, expected to provide resistance. Similarly, the daily 61.8% fib level is at 0.8971, expected to provide resistance.
Note the levels of interest below:
- Pivot support is noted at 0.8941, 0.8908, 0.8872
- Pivot resistance is noted at 0.901, 0.9046, 0.9078
| Levels | Levels.1 |
|---|---|
| Previous Daily High | 0.9013 |
| Previous Daily Low | 0.8944 |
| Previous Weekly High | 0.9013 |
| Previous Weekly Low | 0.8907 |
| Previous Monthly High | 0.9148 |
| Previous Monthly Low | 0.8820 |
| Daily Fibonacci 38.2% | 0.8987 |
| Daily Fibonacci 61.8% | 0.8971 |
| Daily Pivot Point S1 | 0.8941 |
| Daily Pivot Point S2 | 0.8908 |
| Daily Pivot Point S3 | 0.8872 |
| Daily Pivot Point R1 | 0.9010 |
| Daily Pivot Point R2 | 0.9046 |
| Daily Pivot Point R3 | 0.9078 |
[/s2If]
Nehcap Expert Advisor
The NEHCAP MT4 EA is high quality professional trading system geared to generate returns without using GRID or martingales. Each trade has strict risk per trade parameter. The pairs under management include EURUSD, GBPUSD, AUDCAD, AUDNZD,GBPAUD, EURAUD, EURCAD, CHFJPY and many more.
The system is trading live: LIVE ACCOUNT TRACKING
You can run it free. Apply for a free trial and track our account. Buy the system or use profit share mechanism to generate returns on your MT4.
Join Our Telegram Group
")


