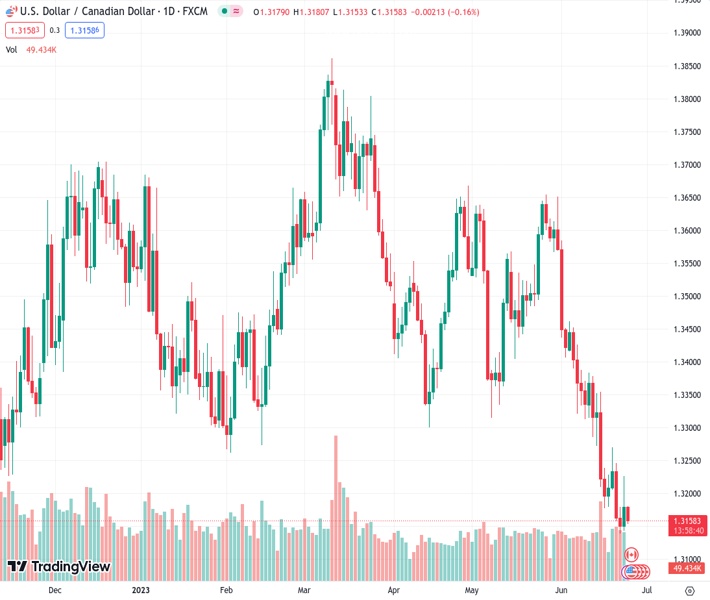
According to Nehcap’s perspective, the USDCAD currency pair at a rate of 1.31583 indicates an unsuccessful attempt at regaining value after reaching a low point over a period of nine months. The pair remains within a bearish channel on a weekly basis, which suggests a negative outlook.
…
This is a premium post.
[s2If !current_user_can(access_s2member_level4)]Please register for FREE REGISTER to read full post below containing analysis. In case of any error or you think you are not able to read the full post below, please email us at support#nehcap.com [lwa][/s2If] [s2If current_user_can(access_s2member_level1)]
- USD/CAD portrays failed recovery from nine-month low, within weekly bearish channel.
The pair currently trades last at 1.31583.
The previous day high was 1.3226 while the previous day low was 1.3143. The daily 38.2% Fib levels comes at 1.3194, expected to provide resistance. Similarly, the daily 61.8% fib level is at 1.3175, expected to provide resistance.
USD/CAD stays on the back foot around 1.3160 heading into Monday’s European session, fading the previous day’s corrective bounce off the nine-month low. In doing so, the Loonie pair fades bounce off a three-day-old rising support line within a one-week-old bearish trend channel.
It’s worth noting that the below 50.0 levels of the RSI (14) joins bearish MACD signals to support the downward grind of the USD/CAD price.
However, the immediate rising support line and the stated bearish channel’s bottom, respectively near 1.3150 and 1.3110, can allow the USD/CAD traders to portray bottom-picking. Also acting as the downside filter is the 1.3100 round figure.
It’s worth noting that the rejection of the immediate bearish chart formation, by a successful upside break of the 1.3215 hurdle isn’t enough for the USD/CAD bulls to retake control.
The reason could be linked to the 200-Hour Moving Average (HMA) and a downward-sloping resistance line from June 12, close to 1.3225 and 1.3265 in that order.
Overall, USD/CAD is likely to continue its southward trajectory with intermediate bounces.
Apart from the technical details, the volatile Oil prices and the US Dollar’s retreat also tease the Loonie pair sellers.
Also read: USD/CAD slips below 1.3200 as US Dollar retreats ahead of US/Canada inflation, ignores downbeat Oil Price
Trend: Bearish
Technical Levels: Supports and Resistances
USDCAD currently trading at 1.3163 at the time of writing. Pair opened at 1.3183 and is trading with a change of -0.15% % .
| Overview | Overview.1 | |
|---|---|---|
| 0 | Today last price | 1.3163 |
| 1 | Today Daily Change | -0.0020 |
| 2 | Today Daily Change % | -0.15% |
| 3 | Today daily open | 1.3183 |
The pair remains strongly bearish on the daily time frame. It trades below the 20 SMA @ 1.3347, 50 SMA 1.3446, 100 SMA @ 1.3505 and 200 SMA @ 1.3519.
| Trends | Trends.1 | |
|---|---|---|
| 0 | Daily SMA20 | 1.3347 |
| 1 | Daily SMA50 | 1.3446 |
| 2 | Daily SMA100 | 1.3505 |
| 3 | Daily SMA200 | 1.3519 |
The previous day high was 1.3226 while the previous day low was 1.3143. The daily 38.2% Fib levels comes at 1.3194, expected to provide resistance. Similarly, the daily 61.8% fib level is at 1.3175, expected to provide resistance.
Note the levels of interest below:
- Pivot support is noted at 1.3142, 1.3101, 1.306
- Pivot resistance is noted at 1.3225, 1.3267, 1.3308
| Levels | Levels.1 |
|---|---|
| Previous Daily High | 1.3226 |
| Previous Daily Low | 1.3143 |
| Previous Weekly High | 1.3270 |
| Previous Weekly Low | 1.3139 |
| Previous Monthly High | 1.3655 |
| Previous Monthly Low | 1.3315 |
| Daily Fibonacci 38.2% | 1.3194 |
| Daily Fibonacci 61.8% | 1.3175 |
| Daily Pivot Point S1 | 1.3142 |
| Daily Pivot Point S2 | 1.3101 |
| Daily Pivot Point S3 | 1.3060 |
| Daily Pivot Point R1 | 1.3225 |
| Daily Pivot Point R2 | 1.3267 |
| Daily Pivot Point R3 | 1.3308 |
[/s2If]
Nehcap Expert Advisor
The NEHCAP MT4 EA is high quality professional trading system geared to generate returns without using GRID or martingales. Each trade has strict risk per trade parameter. The pairs under management include EURUSD, GBPUSD, AUDCAD, AUDNZD,GBPAUD, EURAUD, EURCAD, CHFJPY and many more.
The system is trading live: LIVE ACCOUNT TRACKING
You can run it free. Apply for a free trial and track our account. Buy the system or use profit share mechanism to generate returns on your MT4.
Join Our Telegram Group
")


