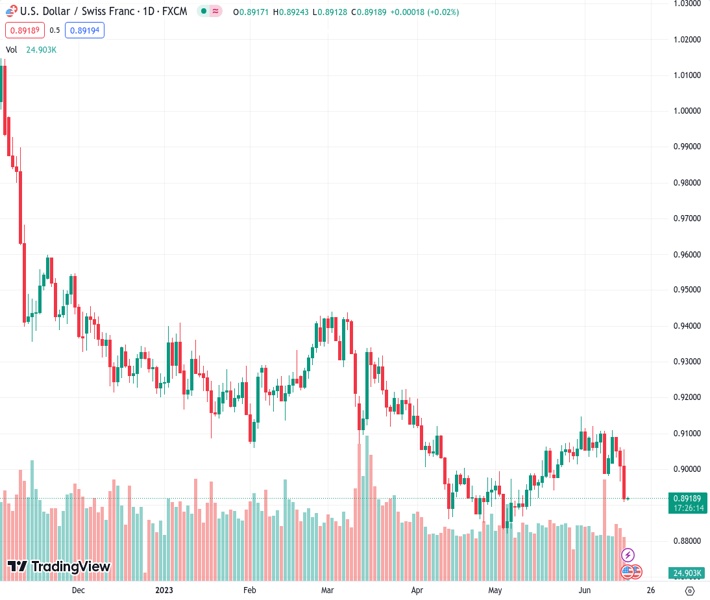
The USDCHF at 0.89190 is stabilizing after a recent decline that brought it down to its lowest level in over a month.
…
This is a premium post.
[s2If !current_user_can(access_s2member_level4)]Please register for FREE REGISTER to read full post below containing analysis. In case of any error or you think you are not able to read the full post below, please email us at support#nehcap.com [lwa][/s2If] [s2If current_user_can(access_s2member_level1)]
- USD/CHF consolidates its recent slump to over a one-month low.
The pair currently trades last at 0.89190.
The previous day high was 0.9056 while the previous day low was 0.8907. The daily 38.2% Fib levels comes at 0.8964, expected to provide resistance. Similarly, the daily 61.8% fib level is at 0.8999, expected to provide resistance.
The USD/CHF pair oscillates in a narrow trading band through the Asian session on Friday and consolidates its heavy losses recorded over the past three days. The pair, so far, has managed to defend and hold above the 0.8900 mark, or over a one-month low touched the previous day, though any meaningful recovery still seems elusive.
The US Dollar (USD) struggles to attract any buyers and languished near a five-week low, which, in turn, is seen as a key factor acting as a headwind for the USD/CHF pair. Despite the Federal Reserve’s (Fed) hawkish outlook, investors seem convinced that the US central bank is nearing the end of its year-long rate-hiking cycle. This was reinforced by the overnight slump in the US treasury bond yields, which, along with the post-ECB surge in the shared currency, keep the USD depressed near a five-week low and acts as a headwind for the USD/CHF pair.
It is worth recalling that the US central bank decided to leave interest rates unchanged at the end of a two-day policy meeting on Wednesday, though signalled that borrowing costs may still need to rise by as much as 50 bps by the end of this year. In fact, the so-called “dot plot” indicated that officials now see rates peaking at 5.6% this year, higher than March’s projection of 5.1%. Apart from this, the Fed expects slightly stronger growth and forecasts the economy to expand by 1% this year — up from the 0.4% rise projected in May — before rising 1.1% in 2024 and 1.8% in 2025.
This, in turn, is holding back traders from placing fresh bearish bets around the USD. Furthermore, a generally positive tone around the equity markets undermines the safe-haven Swiss Franc (CHF) and contributes to limiting the downside for the USD/CHF pair, at least for the time being. Any meaningful recovery, however, still seems elusive, warranting some caution for aggressive bullish traders in the absence of any relevant market moving economic releases from the US. Nevertheless, spot prices remain on track to end deep in the red for the second successive week.
Technical Levels: Supports and Resistances
USDCHF currently trading at 0.892 at the time of writing. Pair opened at 0.8919 and is trading with a change of 0.01 % .
| Overview | Overview.1 | |
|---|---|---|
| 0 | Today last price | 0.8920 |
| 1 | Today Daily Change | 0.0001 |
| 2 | Today Daily Change % | 0.0100 |
| 3 | Today daily open | 0.8919 |
The pair remains strongly bearish on the daily time frame. It trades below the 20 SMA @ 0.9042, 50 SMA 0.8985, 100 SMA @ 0.9112 and 200 SMA @ 0.9343.
| Trends | Trends.1 | |
|---|---|---|
| 0 | Daily SMA20 | 0.9042 |
| 1 | Daily SMA50 | 0.8985 |
| 2 | Daily SMA100 | 0.9112 |
| 3 | Daily SMA200 | 0.9343 |
The previous day high was 0.9056 while the previous day low was 0.8907. The daily 38.2% Fib levels comes at 0.8964, expected to provide resistance. Similarly, the daily 61.8% fib level is at 0.8999, expected to provide resistance.
Note the levels of interest below:
- Pivot support is noted at 0.8865, 0.8812, 0.8716
- Pivot resistance is noted at 0.9014, 0.911, 0.9163
| Levels | Levels.1 |
|---|---|
| Previous Daily High | 0.9056 |
| Previous Daily Low | 0.8907 |
| Previous Weekly High | 0.9120 |
| Previous Weekly Low | 0.8984 |
| Previous Monthly High | 0.9148 |
| Previous Monthly Low | 0.8820 |
| Daily Fibonacci 38.2% | 0.8964 |
| Daily Fibonacci 61.8% | 0.8999 |
| Daily Pivot Point S1 | 0.8865 |
| Daily Pivot Point S2 | 0.8812 |
| Daily Pivot Point S3 | 0.8716 |
| Daily Pivot Point R1 | 0.9014 |
| Daily Pivot Point R2 | 0.9110 |
| Daily Pivot Point R3 | 0.9163 |
[/s2If]
Nehcap Expert Advisor
The NEHCAP MT4 EA is high quality professional trading system geared to generate returns without using GRID or martingales. Each trade has strict risk per trade parameter. The pairs under management include EURUSD, GBPUSD, AUDCAD, AUDNZD,GBPAUD, EURAUD, EURCAD, CHFJPY and many more.
The system is trading live: LIVE ACCOUNT TRACKING
You can run it free. Apply for a free trial and track our account. Buy the system or use profit share mechanism to generate returns on your MT4.
Join Our Telegram Group
")


