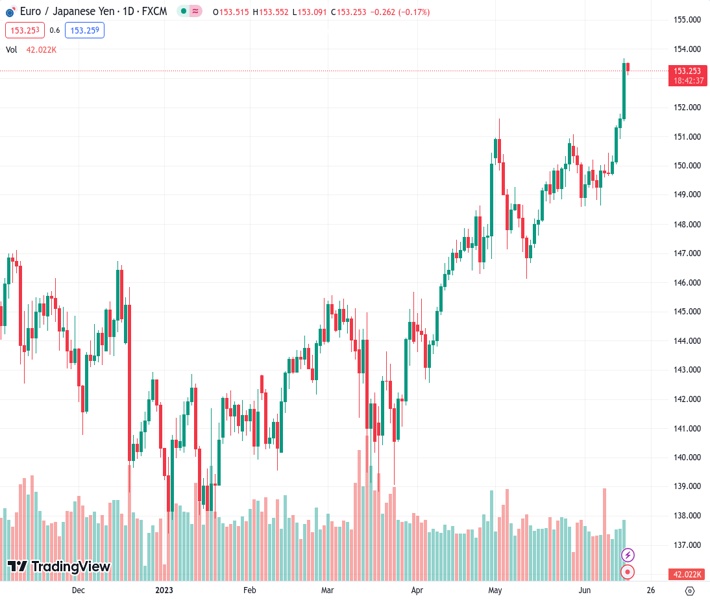
The EURJPY, trading at 153.266, experiences a decline after reaching a high that was close to its 15-year record on Thursday.
…
This is a premium post.
[s2If !current_user_can(access_s2member_level4)]Please register for FREE REGISTER to read full post below containing analysis. In case of any error or you think you are not able to read the full post below, please email us at support#nehcap.com [lwa][/s2If] [s2If current_user_can(access_s2member_level1)]
- EUR/JPY pulls back from a nearly 15-year top touched on Thursday.
The pair currently trades last at 153.266.
The previous day high was 153.69 while the previous day low was 151.62. The daily 38.2% Fib levels comes at 152.9, expected to provide support. Similarly, the daily 61.8% fib level is at 152.41, expected to provide support.
The EUR/JPY cross comes under some selling pressure during the Asian session on Friday and erodes a part of the previous day’s strong move up to its highest level since September 2008. Spot prices currently trade just above the 153.00 mark, down nearly 0.30% for the day, though any meaningful corrective decline still seems elusive.
The intraday downtick, meanwhile, could be attributed to some repositioning trade ahead of the Bank of Japan (BoJ) monetary policy decision, scheduled to be announced at 03:00 GMT this Friday. The Japanese central bank is widely anticipated to stick to the ultra-loose policy settings, including the yield curve control policy. The expectations were reaffirmed by recent remarks by several BoJ officials, including Governor Kazuo Ueda, which might continue to undermine the Japanese Yen (JPY) and lend support to the EUR/JPY cross.
Adding to this, reduced bets for an intervention by the Japanese government, to stabilize the domestic currency, along with a generally positive tone around the equity markets, could further weigh on the JPY. The shared currency, on the other hand, might continue to draw support from the European Central Bank’s (ECB) lift-off for the eighth straight time in June and hawkish outlook, signalling further tightening to bring Eurozone inflation to the 2% target. This might further contribute to limiting the downside for the EUR/JPY cross.
Even from a technical perspective, this week’s sustained breakout through the 151.00 horizontal barrier was seen as a fresh trigger for bullish traders and supports prospects for additional gains. That said, the Relative Strength Index (RSI) on the daily chart is flashing overbought conditions and warrants some caution. Nevertheless, the EUR/JPY cross seems poised to register strong weekly gains and prolong its recent upward trajectory witnessed over the past three months or so.
Technical Levels: Supports and Resistances
EURJPY currently trading at 153.17 at the time of writing. Pair opened at 153.58 and is trading with a change of -0.27 % .
| Overview | Overview.1 | |
|---|---|---|
| 0 | Today last price | 153.17 |
| 1 | Today Daily Change | -0.41 |
| 2 | Today Daily Change % | -0.27 |
| 3 | Today daily open | 153.58 |
The pair remains strongly bullish on the daily timeframe. It trades above its 20 SMA @ 150.14, 50 SMA 148.68, 100 SMA @ 145.75 and 200 SMA @ 144.43.
| Trends | Trends.1 | |
|---|---|---|
| 0 | Daily SMA20 | 150.14 |
| 1 | Daily SMA50 | 148.68 |
| 2 | Daily SMA100 | 145.75 |
| 3 | Daily SMA200 | 144.43 |
The previous day high was 153.69 while the previous day low was 151.62. The daily 38.2% Fib levels comes at 152.9, expected to provide support. Similarly, the daily 61.8% fib level is at 152.41, expected to provide support.
Note the levels of interest below:
- Pivot support is noted at 152.24, 150.89, 150.17
- Pivot resistance is noted at 154.31, 155.03, 156.38
| Levels | Levels.1 |
|---|---|
| Previous Daily High | 153.69 |
| Previous Daily Low | 151.62 |
| Previous Weekly High | 150.44 |
| Previous Weekly Low | 148.63 |
| Previous Monthly High | 151.62 |
| Previous Monthly Low | 146.14 |
| Daily Fibonacci 38.2% | 152.90 |
| Daily Fibonacci 61.8% | 152.41 |
| Daily Pivot Point S1 | 152.24 |
| Daily Pivot Point S2 | 150.89 |
| Daily Pivot Point S3 | 150.17 |
| Daily Pivot Point R1 | 154.31 |
| Daily Pivot Point R2 | 155.03 |
| Daily Pivot Point R3 | 156.38 |
[/s2If]
Nehcap Expert Advisor
The NEHCAP MT4 EA is high quality professional trading system geared to generate returns without using GRID or martingales. Each trade has strict risk per trade parameter. The pairs under management include EURUSD, GBPUSD, AUDCAD, AUDNZD,GBPAUD, EURAUD, EURCAD, CHFJPY and many more.
The system is trading live: LIVE ACCOUNT TRACKING
You can run it free. Apply for a free trial and track our account. Buy the system or use profit share mechanism to generate returns on your MT4.
Join Our Telegram Group
")


