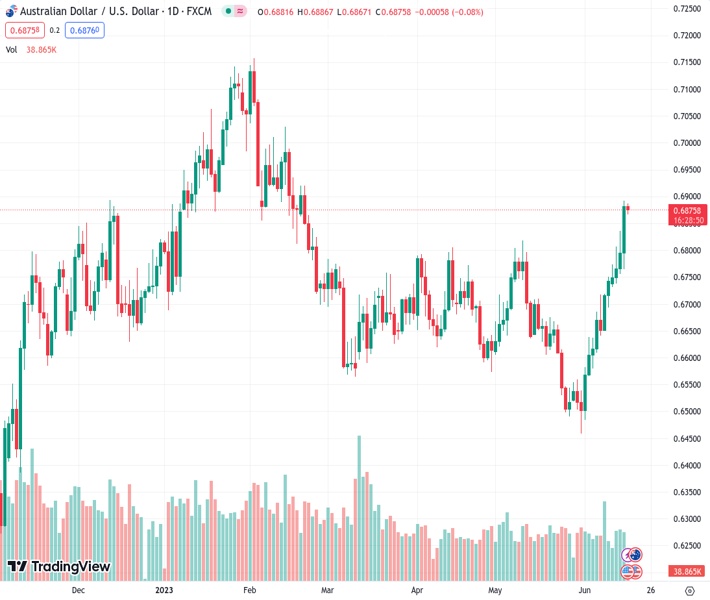
The AUDUSD pair, which reached its highest point since February on Thursday, is currently undergoing a correction. The current rate is 0.68754.
…
This is a premium post.
[s2If !current_user_can(access_s2member_level4)]Please register for FREE REGISTER to read full post below containing analysis. In case of any error or you think you are not able to read the full post below, please email us at support#nehcap.com [lwa][/s2If] [s2If current_user_can(access_s2member_level1)]
- AUD/USD corrects from its highest level since February touched on Thursday.
The pair currently trades last at 0.68754.
The previous day high was 0.6893 while the previous day low was 0.6767. The daily 38.2% Fib levels comes at 0.6845, expected to provide support. Similarly, the daily 61.8% fib level is at 0.6815, expected to provide support.
The AUD/USD pair comes under some selling pressure during the Asian session on Friday and erodes a part of the previous day’s blowout rally to 0.6900 neighbourhood, or its highest level since February 22. The pair currently trades around the 0.6870 region, down over 0.20% for the day, and for now, seems to have snapped a six-day winning streak.
Having registered heavy losses over the past three days, the US Dollar (USD) stages a modest bounce from over a five-week low. This, in turn, prompts traders to lighten their bullish bets around the AUD/USD pair, especially after the recent blowout rally of over 500 pips since the beginning of the current week. The USD upside, however, seems limited in the wake of expectations that the Federal Reserve (Fed) is getting closer to the peak of its policy tightening cycle, warranting caution before positioning for any meaningful corrective slide for the major.
It is worth recalling that the US central bank decided to leave interest rates unchanged at the end of a two-day policy meeting earlier this week, though indicated that borrowing costs may still need to rise by as much as 50 bps by the end of this year. That said, Thursday’s rather unimpressive US macro data – namely Industrial Production, Weekly Jobless Claims and Retail Sales – raised questions over the prospects for additional rate hikes by the Fed to combat stubbornly high inflation. In fact, the US CPI, at 4.0% in May, is still twice the Fed’s 2% target.
The uncertainty over the Fed’s rate-hike path led to the overnight slump in the US Treasury bond yields, which might hold back the USD bulls from placing aggressive bets. Apart from this, the Reserve Bank of Australia’s (RBA) surprise 25 bps lift-off last week and a hawkish policy statement might continue to underpin the Aussie. This might further contribute to limiting the downside for the AUD/USD pair in the absence of any relevant macro data from the US. Nevertheless, spot prices remain on track to record strong gains for the third successive week.
Technical Levels: Supports and Resistances
AUDUSD currently trading at 0.687 at the time of writing. Pair opened at 0.6885 and is trading with a change of -0.22 % .
| Overview | Overview.1 | |
|---|---|---|
| 0 | Today last price | 0.6870 |
| 1 | Today Daily Change | -0.0015 |
| 2 | Today Daily Change % | -0.2200 |
| 3 | Today daily open | 0.6885 |
The pair remains strongly bullish on the daily timeframe. It trades above its 20 SMA @ 0.6641, 50 SMA 0.6668, 100 SMA @ 0.673 and 200 SMA @ 0.6692.
| Trends | Trends.1 | |
|---|---|---|
| 0 | Daily SMA20 | 0.6641 |
| 1 | Daily SMA50 | 0.6668 |
| 2 | Daily SMA100 | 0.6730 |
| 3 | Daily SMA200 | 0.6692 |
The previous day high was 0.6893 while the previous day low was 0.6767. The daily 38.2% Fib levels comes at 0.6845, expected to provide support. Similarly, the daily 61.8% fib level is at 0.6815, expected to provide support.
Note the levels of interest below:
- Pivot support is noted at 0.6804, 0.6722, 0.6678
- Pivot resistance is noted at 0.6929, 0.6974, 0.7055
| Levels | Levels.1 |
|---|---|
| Previous Daily High | 0.6893 |
| Previous Daily Low | 0.6767 |
| Previous Weekly High | 0.6751 |
| Previous Weekly Low | 0.6579 |
| Previous Monthly High | 0.6818 |
| Previous Monthly Low | 0.6458 |
| Daily Fibonacci 38.2% | 0.6845 |
| Daily Fibonacci 61.8% | 0.6815 |
| Daily Pivot Point S1 | 0.6804 |
| Daily Pivot Point S2 | 0.6722 |
| Daily Pivot Point S3 | 0.6678 |
| Daily Pivot Point R1 | 0.6929 |
| Daily Pivot Point R2 | 0.6974 |
| Daily Pivot Point R3 | 0.7055 |
[/s2If]
Nehcap Expert Advisor
The NEHCAP MT4 EA is high quality professional trading system geared to generate returns without using GRID or martingales. Each trade has strict risk per trade parameter. The pairs under management include EURUSD, GBPUSD, AUDCAD, AUDNZD,GBPAUD, EURAUD, EURCAD, CHFJPY and many more.
The system is trading live: LIVE ACCOUNT TRACKING
You can run it free. Apply for a free trial and track our account. Buy the system or use profit share mechanism to generate returns on your MT4.
Join Our Telegram Group
")


