On Friday, the USDJPY currency pair at 140.715 experienced an increase in demand due to the Bank of Japan’s accommodative position.
…
This is a premium post.
[s2If !current_user_can(access_s2member_level4)]Please register for FREE REGISTER to read full post below containing analysis. In case of any error or you think you are not able to read the full post below, please email us at support#nehcap.com [lwa][/s2If] [s2If current_user_can(access_s2member_level1)]
- USD/JPY catches fresh bids on Friday in reaction to the BoJ’s dovish stance.
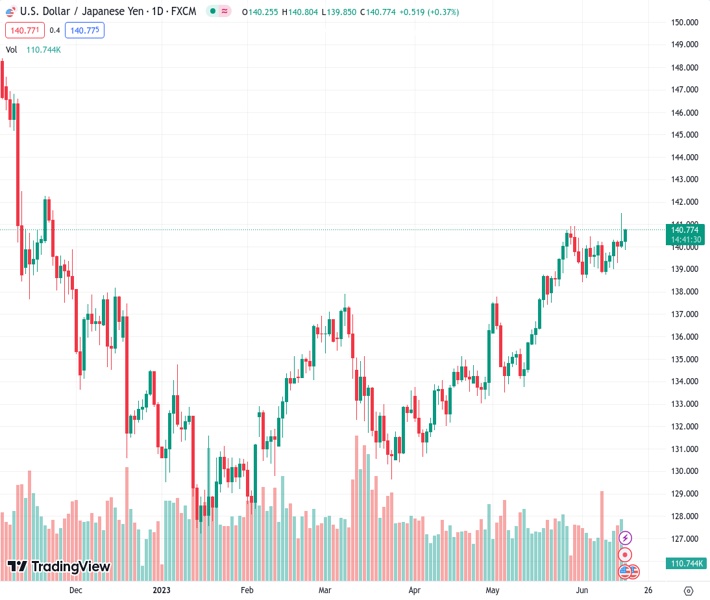
The pair currently trades last at 140.715.
The previous day high was 141.5 while the previous day low was 139.94. The daily 38.2% Fib levels comes at 140.91, expected to provide resistance. Similarly, the daily 61.8% fib level is at 140.54, expected to provide support.
The USD/’JPY pair attracts fresh buyers after the Bank of Japan (BoJ) announced its policy decision earlier this Friday and stalls the overnight retracement slide from the 141.50 region, or its highest level since November 2022. The pair maintains its bid tone heading into the European session and current trades near the top end of its daily range, around the 140.65-140.70 area.
The Japanese Yen (JPY) weakens across the board in reaction to the BoJ’s decision to maintain its ultra-loose monetary policy stance to support fragile economic growth. The Japanese central bank held its short-term interest rate target at -0.1%, as expected, and made no changes to its yield curve control policy after a two-day meeting. The BoJ also kept intact its view that inflation will slow later this year, suggesting that it will remain a dovish outlier amid global uncertainty. This, along with a modest US Dollar (USD) strength, assists the USD/JPY pair to regain some positive traction on the last day of the week.
Having registered heavy losses over the past three days, the USD Index (DXY), which tracks the Greenback against a basket of currencies, stages a modest bounce from over a five-week low and draws support from an uptick in the US Treasury bond yields. That said, any meaningful USD rally seems limited in the wake of expectations that the Federal Reserve (Fed) is getting closer to the peak of its policy tightening cycle. Thursday’s rather unimpressive US macro data – namely Industrial Production, Weekly Jobless Claims and Retail Sales – raised questions over the prospects for additional rate hikes by the Fed.
The US central bank, meanwhile, indicated earlier this week that borrowing costs may still need to rise by as much as 50 bps by the end of this year. This marks a big divergence in comparison to the BoJ’s dovish outlook, which might continue to undermine the JPY. Apart from this, diminishing odds for an intervention by the Japanese government to stabilize the domestic currency suggests that the path of least resistance for the USD/JPY pair is to the upside. Hence, any intraday dip might still be seen as a buying opportunity and remain cushioned in the absence of any relevant market-moving data from the US.
Technical Levels: Supports and Resistances
USDJPY currently trading at 140.76 at the time of writing. Pair opened at 140.35 and is trading with a change of 0.29 % .
| Overview | Overview.1 | |
|---|---|---|
| 0 | Today last price | 140.76 |
| 1 | Today Daily Change | 0.41 |
| 2 | Today Daily Change % | 0.29 |
| 3 | Today daily open | 140.35 |
The pair remains strongly bullish on the daily timeframe. It trades above its 20 SMA @ 139.58, 50 SMA 136.71, 100 SMA @ 134.89 and 200 SMA @ 137.24.
| Trends | Trends.1 | |
|---|---|---|
| 0 | Daily SMA20 | 139.58 |
| 1 | Daily SMA50 | 136.71 |
| 2 | Daily SMA100 | 134.89 |
| 3 | Daily SMA200 | 137.24 |
The previous day high was 141.5 while the previous day low was 139.94. The daily 38.2% Fib levels comes at 140.91, expected to provide resistance. Similarly, the daily 61.8% fib level is at 140.54, expected to provide support.
Note the levels of interest below:
- Pivot support is noted at 139.7, 139.04, 138.14
- Pivot resistance is noted at 141.26, 142.16, 142.82
| Levels | Levels.1 |
|---|---|
| Previous Daily High | 141.50 |
| Previous Daily Low | 139.94 |
| Previous Weekly High | 140.45 |
| Previous Weekly Low | 138.76 |
| Previous Monthly High | 140.93 |
| Previous Monthly Low | 133.50 |
| Daily Fibonacci 38.2% | 140.91 |
| Daily Fibonacci 61.8% | 140.54 |
| Daily Pivot Point S1 | 139.70 |
| Daily Pivot Point S2 | 139.04 |
| Daily Pivot Point S3 | 138.14 |
| Daily Pivot Point R1 | 141.26 |
| Daily Pivot Point R2 | 142.16 |
| Daily Pivot Point R3 | 142.82 |
[/s2If]
Nehcap Expert Advisor
The NEHCAP MT4 EA is high quality professional trading system geared to generate returns without using GRID or martingales. Each trade has strict risk per trade parameter. The pairs under management include EURUSD, GBPUSD, AUDCAD, AUDNZD,GBPAUD, EURAUD, EURCAD, CHFJPY and many more.
The system is trading live: LIVE ACCOUNT TRACKING
You can run it free. Apply for a free trial and track our account. Buy the system or use profit share mechanism to generate returns on your MT4.
Join Our Telegram Group
")


