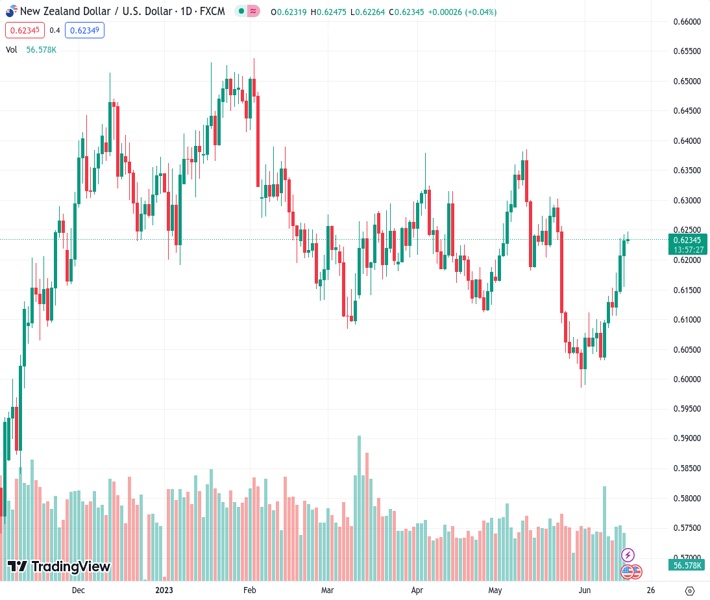
On Friday, the NZDUSD pair rose to an almost four-week peak and kept climbing higher, reaching 0.62359.
…
This is a premium post.
[s2If !current_user_can(access_s2member_level4)]Please register for FREE REGISTER to read full post below containing analysis. In case of any error or you think you are not able to read the full post below, please email us at support#nehcap.com [lwa][/s2If] [s2If current_user_can(access_s2member_level1)]
- NZD/USD continues scaling higher on Friday and climbs to a nearly four-week high.
The pair currently trades last at 0.62359.
The previous day high was 0.6244 while the previous day low was 0.6076. The daily 38.2% Fib levels comes at 0.618, expected to provide support. Similarly, the daily 61.8% fib level is at 0.614, expected to provide support.
The NZD/USD pair prolongs its recent upward trajectory witnessed since the beginning of the current month and climbs to over a three-week high on Friday. The pair maintains its bid tone, just below mid-0.6200s heading into the European session and now seems to have found acceptance above a technically significant 200-day Simple Moving Average (SMA).
The US Dollar (USD) continues with its struggle to register any meaningful recovery and remains depressed near a five-week low, which, in turn, is seen acting as a tailwind for the NZD/USD pair. Despite the Federal Reserve’s (Fed) hawkish signal that borrowing costs may still need to rise by as much as 50 bps by the end of this year, investors seem convinced that the US central bank is getting closer to the peak of its policy tightening cycle. Moreover, Thursday’s rather unimpressive US macro data raised questions over how much headroom the US central bank has to keep raising rates., which continues to undermine the buck.
Apart from this, a generally positive tone around the equity markets is seen as another factor weighing on the safe-haven Greenback and benefitting the risk-sensitive Kiwi. That said, worries about a global economic downturn, particularly in China, might keep a lid on any optimism. Furthermore, a modest uptick in the US Treasury bond yields could limit the USD losses. This, along with the Reserve Bank of New Zealand’s (RBNZ) explicit signal that it was done with its most aggressive hiking cycle since 1999 and a technical recession in New Zealand, might hold back bulls from placing fresh bets around the NZD/USD pair.
Nevertheless, spot prices remain on track to register strong weekly gains and end in the green for the third successive week. In the absence of any relevant market-moving economic releases from the US, traders on Friday will take cues from Governor Christopher Waller’s public appearance later during the early North American session. This, along with the US bond yields, will influence the USD price dynamics and provide some impetus to the NZD/USD pair. Apart from this, the broader risk sentiment might further contribute to producing short-term trading opportunities on the last day of the week.
Technical Levels: Supports and Resistances
NZDUSD currently trading at 0.6244 at the time of writing. Pair opened at 0.6242 and is trading with a change of 0.03 % .
| Overview | Overview.1 | |
|---|---|---|
| 0 | Today last price | 0.6244 |
| 1 | Today Daily Change | 0.0002 |
| 2 | Today Daily Change % | 0.0300 |
| 3 | Today daily open | 0.6242 |
The pair remains strongly bullish on the daily timeframe. It trades above its 20 SMA @ 0.6114, 50 SMA 0.6179, 100 SMA @ 0.6221 and 200 SMA @ 0.6151.
| Trends | Trends.1 | |
|---|---|---|
| 0 | Daily SMA20 | 0.6114 |
| 1 | Daily SMA50 | 0.6179 |
| 2 | Daily SMA100 | 0.6221 |
| 3 | Daily SMA200 | 0.6151 |
The previous day high was 0.6244 while the previous day low was 0.6076. The daily 38.2% Fib levels comes at 0.618, expected to provide support. Similarly, the daily 61.8% fib level is at 0.614, expected to provide support.
Note the levels of interest below:
- Pivot support is noted at 0.6131, 0.6019, 0.5963
- Pivot resistance is noted at 0.6299, 0.6355, 0.6467
| Levels | Levels.1 |
|---|---|
| Previous Daily High | 0.6244 |
| Previous Daily Low | 0.6076 |
| Previous Weekly High | 0.6143 |
| Previous Weekly Low | 0.6026 |
| Previous Monthly High | 0.6385 |
| Previous Monthly Low | 0.5985 |
| Daily Fibonacci 38.2% | 0.6180 |
| Daily Fibonacci 61.8% | 0.6140 |
| Daily Pivot Point S1 | 0.6131 |
| Daily Pivot Point S2 | 0.6019 |
| Daily Pivot Point S3 | 0.5963 |
| Daily Pivot Point R1 | 0.6299 |
| Daily Pivot Point R2 | 0.6355 |
| Daily Pivot Point R3 | 0.6467 |
[/s2If]
Nehcap Expert Advisor
The NEHCAP MT4 EA is high quality professional trading system geared to generate returns without using GRID or martingales. Each trade has strict risk per trade parameter. The pairs under management include EURUSD, GBPUSD, AUDCAD, AUDNZD,GBPAUD, EURAUD, EURCAD, CHFJPY and many more.
The system is trading live: LIVE ACCOUNT TRACKING
You can run it free. Apply for a free trial and track our account. Buy the system or use profit share mechanism to generate returns on your MT4.
Join Our Telegram Group
")


