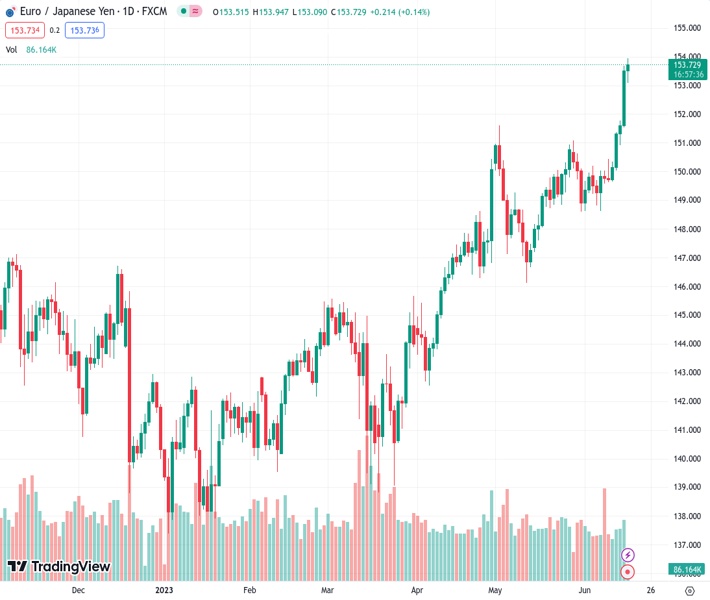
On Friday, the EURJPY pair at 153.711 gained upward momentum and surged to a new highest level in 15 years.
…
This is a premium post.
[s2If !current_user_can(access_s2member_level4)]Please register for FREE REGISTER to read full post below containing analysis. In case of any error or you think you are not able to read the full post below, please email us at support#nehcap.com [lwa][/s2If] [s2If current_user_can(access_s2member_level1)]
- EUR/JPY regains positive traction on Friday and jumps to a fresh 15-year peak.
The pair currently trades last at 153.711.
The previous day high was 153.69 while the previous day low was 151.62. The daily 38.2% Fib levels comes at 152.9, expected to provide support. Similarly, the daily 61.8% fib level is at 152.41, expected to provide support.
The EUR/JPY cross attracts some dip-buying near the 153.00 mark during the Asian session on Friday and hits a fresh 15-year top in reaction to the Bank of Japan (BoJ) policy decision. The cross is currently placed just below the 154.00 round-figure mark and seems poised to build on its recent upward trajectory witnessed over the past month or so.
The Japanese Yen (JPY) weakens across the board after the BoJ, as was widely expected, stuck to its dovish stance and left its ultra-loose policy settings unchanged at the end of the June monetary policy meeting this Friday. This marks a big divergent in comparison to the European Central Bank’s (ECB) hawkish 25 bps lift-off on Thursday, which continues to underpin the shared currency and remains supportive of the bid tone surrounding the EUR/JPY cross.
From a technical perspective, this week’s sustained strength beyond the 151.00 horizontal barrier was seen as a key trigger for bullish traders. The subsequent move up validates the breakout, though the extremely overbought Relative Strength Index (RSI) on the daily chart makes it prudent to wait for some near-term consolidation or a modest pullback before positioning for any further move up. Nevertheless, the EUR/JPY cross remains on track to register strong weekly gains.
In the meantime, the 153.55 region now seems to protect the immediate downside ahead of the daily swing low, around the 153.00 mark. Some follow-through selling below the 152.80 zone might prompt some long-unwinding trade and accelerate the corrective decline towards the 152.00 round figure. Any further downfall, however, is likely to attract fresh buyers and remain cushioned near the previous YTD peak, around the 151.60 region touched in May.
Technical Levels: Supports and Resistances
EURJPY currently trading at 153.72 at the time of writing. Pair opened at 153.58 and is trading with a change of 0.09 % .
| Overview | Overview.1 | |
|---|---|---|
| 0 | Today last price | 153.72 |
| 1 | Today Daily Change | 0.14 |
| 2 | Today Daily Change % | 0.09 |
| 3 | Today daily open | 153.58 |
The pair remains strongly bullish on the daily timeframe. It trades above its 20 SMA @ 150.14, 50 SMA 148.68, 100 SMA @ 145.75 and 200 SMA @ 144.43.
| Trends | Trends.1 | |
|---|---|---|
| 0 | Daily SMA20 | 150.14 |
| 1 | Daily SMA50 | 148.68 |
| 2 | Daily SMA100 | 145.75 |
| 3 | Daily SMA200 | 144.43 |
The previous day high was 153.69 while the previous day low was 151.62. The daily 38.2% Fib levels comes at 152.9, expected to provide support. Similarly, the daily 61.8% fib level is at 152.41, expected to provide support.
Note the levels of interest below:
- Pivot support is noted at 152.24, 150.89, 150.17
- Pivot resistance is noted at 154.31, 155.03, 156.38
| Levels | Levels.1 |
|---|---|
| Previous Daily High | 153.69 |
| Previous Daily Low | 151.62 |
| Previous Weekly High | 150.44 |
| Previous Weekly Low | 148.63 |
| Previous Monthly High | 151.62 |
| Previous Monthly Low | 146.14 |
| Daily Fibonacci 38.2% | 152.90 |
| Daily Fibonacci 61.8% | 152.41 |
| Daily Pivot Point S1 | 152.24 |
| Daily Pivot Point S2 | 150.89 |
| Daily Pivot Point S3 | 150.17 |
| Daily Pivot Point R1 | 154.31 |
| Daily Pivot Point R2 | 155.03 |
| Daily Pivot Point R3 | 156.38 |
[/s2If]
Nehcap Expert Advisor
The NEHCAP MT4 EA is high quality professional trading system geared to generate returns without using GRID or martingales. Each trade has strict risk per trade parameter. The pairs under management include EURUSD, GBPUSD, AUDCAD, AUDNZD,GBPAUD, EURAUD, EURCAD, CHFJPY and many more.
The system is trading live: LIVE ACCOUNT TRACKING
You can run it free. Apply for a free trial and track our account. Buy the system or use profit share mechanism to generate returns on your MT4.
Join Our Telegram Group
")


