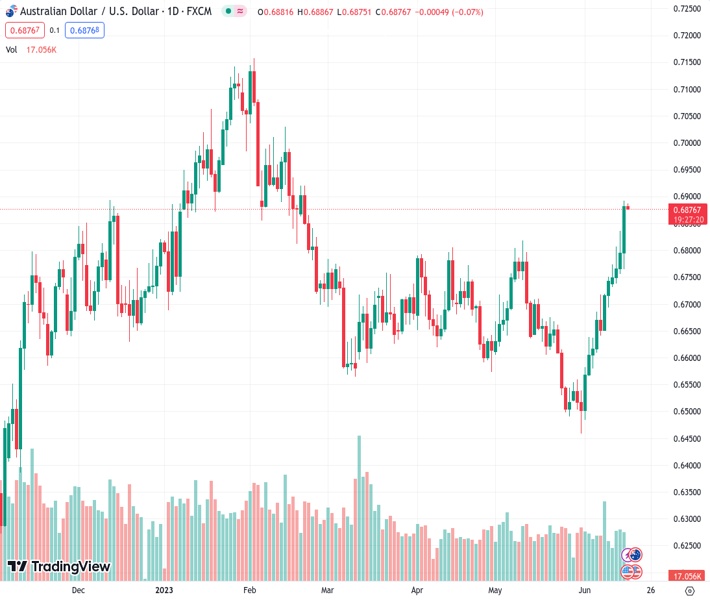
According to @nehcap’s analysis, bulls are currently attempting to breach a resistance line that has been sloping downwards since April 2022, with a current value of AUDUSD at 0.68765. However, a correction in price is anticipated.
…
This is a premium post.
[s2If !current_user_can(access_s2member_level4)]Please register for FREE REGISTER to read full post below containing analysis. In case of any error or you think you are not able to read the full post below, please email us at support#nehcap.com [lwa][/s2If] [s2If current_user_can(access_s2member_level1)]
- AUD/USD bulls attack downward-sloping resistance line from April 2022.
The pair currently trades last at 0.68765.
The previous day high was 0.6893 while the previous day low was 0.6767. The daily 38.2% Fib levels comes at 0.6845, expected to provide support. Similarly, the daily 61.8% fib level is at 0.6815, expected to provide support.
AUD/USD aptly portrays early Friday’s sluggish markets as it seesaws around 0.6880-90 while seeking fresh clues to challenge the four-month high marked the previous day. In doing so, the Aussie pair also justifies the overbought RSI (14) conditions as traders await more clues to confirm the US Federal Reserve’s (Fed) July rate hikes.
Also read: AUD/USD bulls take a breather at 16-week high below 0.6900 as Fed hawks retreat, more US data eyed
Elsewhere, failure to provide a daily closing beyond the key resistance line stretched from April 2022, close to the 0.6900 round figure by the press time, challenges the AUD/USD bulls, especially amid the overbought RSI.
However, the bullish MACD signals and the quote’s successful trading above the 200-day Exponential Moving Average (EMA), as well as an ascending support line stretched from early June, keeps the AUD/USD pair buyers hopeful.
That said, May’s high of 0.6820 appears the short-term important support to watch for the intraday sellers of the AUD/USD pair.
Following that, the aforementioned immediate support line and the 200-EMA, respectively near 0.6785 and 0.6760, will be in the spotlight.
On the flip side, a daily closing beyond the previously mentioned multi-month-old resistance line will need validation from the February 20 swing high of around 0.6920 and the 0.7000 psychological magnet to convince the bulls to aim for the mid-February 2023 peak of 0.7030.
Should the AUD/USD buyers manage to cross the 0.7030 hurdle, the odds of witnessing a run-up toward the yearly peak of 0.7157 can’t be ruled out.
Trend: Pullback expected
Technical Levels: Supports and Resistances
AUDUSD currently trading at 0.6883 at the time of writing. Pair opened at 0.6885 and is trading with a change of -0.03% % .
| Overview | Overview.1 | |
|---|---|---|
| 0 | Today last price | 0.6883 |
| 1 | Today Daily Change | -0.0002 |
| 2 | Today Daily Change % | -0.03% |
| 3 | Today daily open | 0.6885 |
The pair remains strongly bullish on the daily timeframe. It trades above its 20 SMA @ 0.6641, 50 SMA 0.6668, 100 SMA @ 0.673 and 200 SMA @ 0.6692.
| Trends | Trends.1 | |
|---|---|---|
| 0 | Daily SMA20 | 0.6641 |
| 1 | Daily SMA50 | 0.6668 |
| 2 | Daily SMA100 | 0.6730 |
| 3 | Daily SMA200 | 0.6692 |
The previous day high was 0.6893 while the previous day low was 0.6767. The daily 38.2% Fib levels comes at 0.6845, expected to provide support. Similarly, the daily 61.8% fib level is at 0.6815, expected to provide support.
Note the levels of interest below:
- Pivot support is noted at 0.6804, 0.6722, 0.6678
- Pivot resistance is noted at 0.6929, 0.6974, 0.7055
| Levels | Levels.1 |
|---|---|
| Previous Daily High | 0.6893 |
| Previous Daily Low | 0.6767 |
| Previous Weekly High | 0.6751 |
| Previous Weekly Low | 0.6579 |
| Previous Monthly High | 0.6818 |
| Previous Monthly Low | 0.6458 |
| Daily Fibonacci 38.2% | 0.6845 |
| Daily Fibonacci 61.8% | 0.6815 |
| Daily Pivot Point S1 | 0.6804 |
| Daily Pivot Point S2 | 0.6722 |
| Daily Pivot Point S3 | 0.6678 |
| Daily Pivot Point R1 | 0.6929 |
| Daily Pivot Point R2 | 0.6974 |
| Daily Pivot Point R3 | 0.7055 |
[/s2If]
Nehcap Expert Advisor
The NEHCAP MT4 EA is high quality professional trading system geared to generate returns without using GRID or martingales. Each trade has strict risk per trade parameter. The pairs under management include EURUSD, GBPUSD, AUDCAD, AUDNZD,GBPAUD, EURAUD, EURCAD, CHFJPY and many more.
The system is trading live: LIVE ACCOUNT TRACKING
You can run it free. Apply for a free trial and track our account. Buy the system or use profit share mechanism to generate returns on your MT4.
Join Our Telegram Group
")


