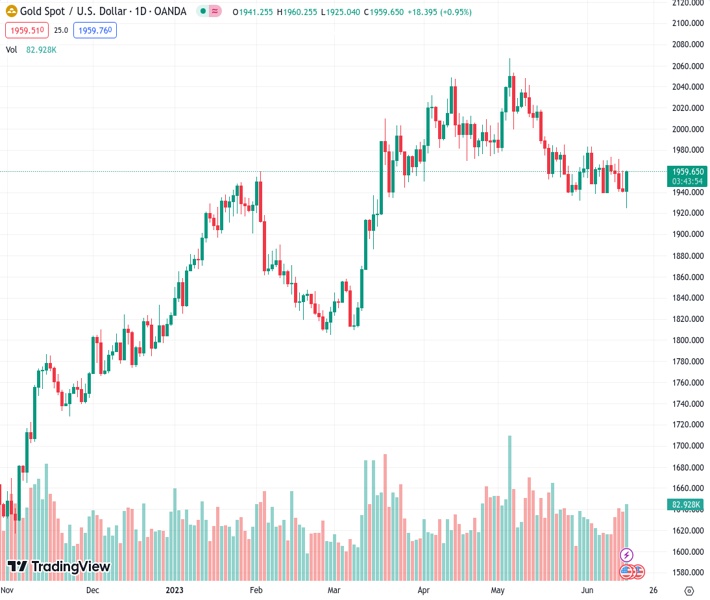
The XAUUSD pair, currently trading at 1,958.87, witnessed a positive movement of 0.86% due to the weaker value of the US Dollar and declining bond yields.
…
This is a premium post.
[s2If !current_user_can(access_s2member_level4)]Please register for FREE REGISTER to read full post below containing analysis. In case of any error or you think you are not able to read the full post below, please email us at support#nehcap.com [lwa][/s2If] [s2If current_user_can(access_s2member_level1)]
- XAU/USD experiences an uptick of 0.86% in the trading, spurred on by a softer US Dollar and falling bond yields.
The pair currently trades last at 1958.87.
The previous day high was 1960.33 while the previous day low was 1939.75. The daily 38.2% Fib levels comes at 1947.61, expected to provide support. Similarly, the daily 61.8% fib level is at 1952.47, expected to provide support.
Gold price bounced off three-month lows of $1925.06, spurred on by a soft US Dollar (USD) and falling US bond yields as the main factors underpinning Gold. At the time of writing, the XAU/USD is trading at $1958.50 a troy ounce, up 0.86%.
Sentiment remains upbeat, even though the Fed’s announced additional hikes needed after holding rates unchanged. Even though the Fed’s decision weakened Gold prices, market participants remain skeptical about the Fed, as US Treasury bond yields retraced from Wednesday’s highs.
The US economic agenda revealed that Retail Sales surprisingly rose in May by 0.3% MoM surpassing estimates but trailing April’s figures. At the same time, the US Department of Labor released the Initial Jobless Claims for the last week, topping forecasts of 249K, it came at 262K, printing back-to-back negative jobs data, indicating the labor market is easing.
Industrial Production showed a further deterioration, contracting -0.2% MoM, missing estimates of 0.1% expansion. Recently, the New York and Philadelphia Fed Manufacturing Indices came mixed, with the NY rebounding unexpectedly after May’s plunge, while the Philly further deteriorated but at a slower pace.
The US Dollar Index (DXY), a gauge that measures the buck’s value vs. a basket of six currencies, tumbles 0.77%, down at 102.209 after hitting a one-month low, while the US 10-year benchmark note yields 3.729%, losses six basis points, from its opening price.
The CME FedWatch Tool shows odds for a 25 bps rate hike in July stand at 67%, but traders in the swaps market expect no additional hikes. Investors estimate the Fed would slash rates as early as January 2024, expecting six rate cuts towards December 2024, with the Federal Funds Rate (FFR) seen at 3.50%-3.75%.
The Fed parade would begin once officials are officially released from the blackout period, ahead of the June meeting, led by the St. Louis Fed President James Bullard. On the data front, the US Consumer Sentiment from the University of Michigan (UoM) and American inflation expectations are expected.
From a technical perspective, the XAU/USD will likely remain sideways after reclaiming the 100-day Exponential Moving Average (EMA) at $1939.26, as the yellow metal slipped to new three-month lows of $1925.06 earlier. On the upside, XAU/USD is capped by the 20 and 50-day EMAs, each at $1961.52 and $1965.76, respectively. Up next, a resistance trendline from the broken descending symmetrical triangle lies around the $1965-75 area before Gold’s test of June 2 high at $1983.44. On the downside, the XAU/USD first support would be the psychological $1950 level, followed by the 100-day EMA.
Technical Levels: Supports and Resistances
XAUUSD currently trading at 1959.03 at the time of writing. Pair opened at 1942.49 and is trading with a change of 0.85 % .
| Overview | Overview.1 | |
|---|---|---|
| 0 | Today last price | 1959.03 |
| 1 | Today Daily Change | 16.54 |
| 2 | Today Daily Change % | 0.85 |
| 3 | Today daily open | 1942.49 |
The pair is trading above its 20 Daily moving average @ 1957.77, below its 50 Daily moving average @ 1987.58 , above its 100 Daily moving average @ 1941.68 and above its 200 Daily moving average @ 1845.19
| Trends | Trends.1 | |
|---|---|---|
| 0 | Daily SMA20 | 1957.77 |
| 1 | Daily SMA50 | 1987.58 |
| 2 | Daily SMA100 | 1941.68 |
| 3 | Daily SMA200 | 1845.19 |
The previous day high was 1960.33 while the previous day low was 1939.75. The daily 38.2% Fib levels comes at 1947.61, expected to provide support. Similarly, the daily 61.8% fib level is at 1952.47, expected to provide support.
Note the levels of interest below:
- Pivot support is noted at 1934.72, 1926.94, 1914.14
- Pivot resistance is noted at 1955.3, 1968.1, 1975.88
| Levels | Levels.1 |
|---|---|
| Previous Daily High | 1960.33 |
| Previous Daily Low | 1939.75 |
| Previous Weekly High | 1973.15 |
| Previous Weekly Low | 1938.15 |
| Previous Monthly High | 2079.76 |
| Previous Monthly Low | 1932.12 |
| Daily Fibonacci 38.2% | 1947.61 |
| Daily Fibonacci 61.8% | 1952.47 |
| Daily Pivot Point S1 | 1934.72 |
| Daily Pivot Point S2 | 1926.94 |
| Daily Pivot Point S3 | 1914.14 |
| Daily Pivot Point R1 | 1955.30 |
| Daily Pivot Point R2 | 1968.10 |
| Daily Pivot Point R3 | 1975.88 |
[/s2If]
Nehcap Expert Advisor
The NEHCAP MT4 EA is high quality professional trading system geared to generate returns without using GRID or martingales. Each trade has strict risk per trade parameter. The pairs under management include EURUSD, GBPUSD, AUDCAD, AUDNZD,GBPAUD, EURAUD, EURCAD, CHFJPY and many more.
The system is trading live: LIVE ACCOUNT TRACKING
You can run it free. Apply for a free trial and track our account. Buy the system or use profit share mechanism to generate returns on your MT4.
Join Our Telegram Group
")


