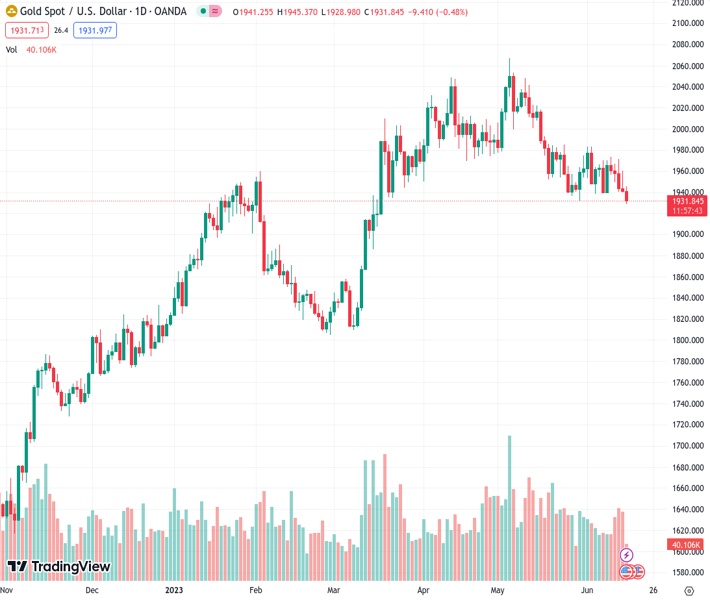
The value of gold, marked at $1,931.32 under the XAUUSD ticker, has decreased following a brief rebound to around $1,934.00 as the Federal Reserve issued a hawkish outlook.
…
This is a premium post.
[s2If !current_user_can(access_s2member_level4)]Please register for FREE REGISTER to read full post below containing analysis. In case of any error or you think you are not able to read the full post below, please email us at support#nehcap.com [lwa][/s2If] [s2If current_user_can(access_s2member_level1)]
- Gold price has displayed a decline after a short-lived pullback to near $1,934.00 as Fed delivered hawkish guidance.
The pair currently trades last at 1931.32.
The previous day high was 1960.33 while the previous day low was 1939.75. The daily 38.2% Fib levels comes at 1947.61, expected to provide resistance. Similarly, the daily 61.8% fib level is at 1952.47, expected to provide resistance.
Gold price (XAU/USD) has witnessed selling pressure after a less-confident recovery to near $1,934.74 in the London session. The precious metal has retreated as a neutral interest rate decision by the Federal Reserve (Fed) is merely a skip. Fed chair Jerome Powell has confirmed that more interest rate hikes will be announced as a victory against stubborn inflation is still far.
S&P500 futures have added more losses in Europe as fears of a recession in the United States are still healthy. The market sentiment is quite cautious as the Fed reiterated that core inflation is still persistent and labor market conditions are extremely tight. Also, Fed Powell confirmed that no rate cuts are appropriate by the year-end.
The US Dollar Index (DXY) has dropped to near 103.15 after facing stiff barricades around 103.40. Some sort of consolidation is anticipated from the USD Index as investors are awaiting the release of the monthly Retail Sales data.
As per the preliminary report, the economic data is seen contracting by 0.1% vs. an expansion of 0.4% registered in April. As food and gasoline prices have fallen significantly, a scrutiny of the Retail Sales report will be required to gauge whether the retail demand has contracted due to lower prices of necessities or the economy is losing resilience.
Gold price has displayed a breakdown of the crucial support plotted from March 22 low at $1,934.34 on a four-hour scale. The precious metal has tested territory below $1,930.00 for the first time in the past three months.
The declining 200-period Exponential Moving Average (EMA) at $1,968.00 indicates that the long-term trend is bearish.
The Relative Strength Index (RSI) (14) has slipped into the bearish range of 20.00-40.00, which indicates that the downside momentum has been triggered.
Technical Levels: Supports and Resistances
XAUUSD currently trading at 1931.71 at the time of writing. Pair opened at 1942.49 and is trading with a change of -0.55 % .
| Overview | Overview.1 | |
|---|---|---|
| 0 | Today last price | 1931.71 |
| 1 | Today Daily Change | -10.78 |
| 2 | Today Daily Change % | -0.55 |
| 3 | Today daily open | 1942.49 |
The pair is trading below its 20 Daily moving average @ 1957.77, below its 50 Daily moving average @ 1987.58 , below its 100 Daily moving average @ 1941.68 and above its 200 Daily moving average @ 1845.19
| Trends | Trends.1 | |
|---|---|---|
| 0 | Daily SMA20 | 1957.77 |
| 1 | Daily SMA50 | 1987.58 |
| 2 | Daily SMA100 | 1941.68 |
| 3 | Daily SMA200 | 1845.19 |
The previous day high was 1960.33 while the previous day low was 1939.75. The daily 38.2% Fib levels comes at 1947.61, expected to provide resistance. Similarly, the daily 61.8% fib level is at 1952.47, expected to provide resistance.
Note the levels of interest below:
- Pivot support is noted at 1934.72, 1926.94, 1914.14
- Pivot resistance is noted at 1955.3, 1968.1, 1975.88
| Levels | Levels.1 |
|---|---|
| Previous Daily High | 1960.33 |
| Previous Daily Low | 1939.75 |
| Previous Weekly High | 1973.15 |
| Previous Weekly Low | 1938.15 |
| Previous Monthly High | 2079.76 |
| Previous Monthly Low | 1932.12 |
| Daily Fibonacci 38.2% | 1947.61 |
| Daily Fibonacci 61.8% | 1952.47 |
| Daily Pivot Point S1 | 1934.72 |
| Daily Pivot Point S2 | 1926.94 |
| Daily Pivot Point S3 | 1914.14 |
| Daily Pivot Point R1 | 1955.30 |
| Daily Pivot Point R2 | 1968.10 |
| Daily Pivot Point R3 | 1975.88 |
[/s2If]
Nehcap Expert Advisor
The NEHCAP MT4 EA is high quality professional trading system geared to generate returns without using GRID or martingales. Each trade has strict risk per trade parameter. The pairs under management include EURUSD, GBPUSD, AUDCAD, AUDNZD,GBPAUD, EURAUD, EURCAD, CHFJPY and many more.
The system is trading live: LIVE ACCOUNT TRACKING
You can run it free. Apply for a free trial and track our account. Buy the system or use profit share mechanism to generate returns on your MT4.
Join Our Telegram Group
")


