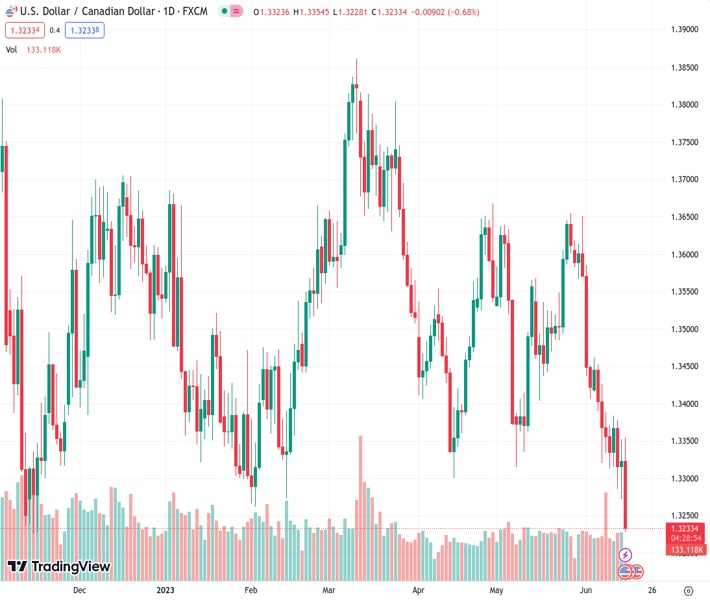
The USDCAD at 1.32356 has its sights set on the 1.3260 lows of November 2022.
…
This is a premium post.
[s2If !current_user_can(access_s2member_level4)]Please register for FREE REGISTER to read full post below containing analysis. In case of any error or you think you are not able to read the full post below, please email us at support#nehcap.com [lwa][/s2If] [s2If current_user_can(access_s2member_level1)]
- USD/CAD targets November 2022 lows at 1.3260.
The pair currently trades last at 1.32356.
The previous day high was 1.3353 while the previous day low was 1.3272. The daily 38.2% Fib levels comes at 1.3322, expected to provide resistance. Similarly, the daily 61.8% fib level is at 1.3303, expected to provide resistance.
In Thursday’s session, the USD/CAD dropped more than 60 pips towards the 1.3245 level amid US Dollar weakness. In that sense, US bond yields are declining while Wall Street indexes trade with gains. On the other hand, amid the positive market sentiment and rising Oil prices, the CAD gained traction
The US Census Bureau confirmed that Retail Sales in the US expanded by 0.3% vs the 0.1% contraction expected, while Jobless Claims in the week that ended in June 9 came in at 262K vs the 249K expected – the same as the previous weekly reading of 262k. It’s worth noticing that US Federal Reserve (Fed) Chairman Jerome Powell noted at Wednesday’s press conference that the labor market in the US remains robust, so signs of unemployment rising make a dovish stance by the Fed more likely.
As a reaction, the US bond yields have weakened across the curve. The 10-year bond yield fell to 3.73%, while the 2-year yield sits at 4.65% and the 5-year yields 3.93% with a 2.03% drop, respectively. In addition, as stocks and bond yields tend to be negatively correlated, the expectations of a less aggressive Fed made the major Wall Street indexes rise with the S&P 500 (SPX) rising more than 0.40% standing at highs since April 2022.
Moreover, the positive market sentiment made Oil prices rise. The Western Texas Intermediate (WTI) rose more than 1% to the $69.80 area benefiting the CAD as Canada is a world-leading oil exporter.
According to the daily chart, the USD/CAD holds a bearish outlook for the short term as the Relative Strength Index (RSI) and Moving Average Convergence Divergence (MACD) both suggest that the sellers are in control while the pair trades below its main moving averages. However, both indicators are near oversold conditions suggesting an upwards correction could come into play.
If USD/CAD manages to move higher, the next resistances to watch are at the 1.3250 zone, followed by the 1.3300 area and the psychological mark at 1.3330. On the other hand, if the pair continues to lose ground, immediate support levels are seen at the November 2022 low at 1.3225, followed by the 1.3200 area.
Technical Levels: Supports and Resistances
USDCAD currently trading at 1.3234 at the time of writing. Pair opened at 1.3324 and is trading with a change of -0.68 % .
| Overview | Overview.1 | |
|---|---|---|
| 0 | Today last price | 1.3234 |
| 1 | Today Daily Change | -0.0090 |
| 2 | Today Daily Change % | -0.6800 |
| 3 | Today daily open | 1.3324 |
The pair remains strongly bearish on the daily time frame. It trades below the 20 SMA @ 1.3472, 50 SMA 1.3481, 100 SMA @ 1.3514 and 200 SMA @ 1.3517.
| Trends | Trends.1 | |
|---|---|---|
| 0 | Daily SMA20 | 1.3472 |
| 1 | Daily SMA50 | 1.3481 |
| 2 | Daily SMA100 | 1.3514 |
| 3 | Daily SMA200 | 1.3517 |
The previous day high was 1.3353 while the previous day low was 1.3272. The daily 38.2% Fib levels comes at 1.3322, expected to provide resistance. Similarly, the daily 61.8% fib level is at 1.3303, expected to provide resistance.
Note the levels of interest below:
- Pivot support is noted at 1.328, 1.3236, 1.3199
- Pivot resistance is noted at 1.3361, 1.3397, 1.3442
| Levels | Levels.1 |
|---|---|
| Previous Daily High | 1.3353 |
| Previous Daily Low | 1.3272 |
| Previous Weekly High | 1.3462 |
| Previous Weekly Low | 1.3313 |
| Previous Monthly High | 1.3655 |
| Previous Monthly Low | 1.3315 |
| Daily Fibonacci 38.2% | 1.3322 |
| Daily Fibonacci 61.8% | 1.3303 |
| Daily Pivot Point S1 | 1.3280 |
| Daily Pivot Point S2 | 1.3236 |
| Daily Pivot Point S3 | 1.3199 |
| Daily Pivot Point R1 | 1.3361 |
| Daily Pivot Point R2 | 1.3397 |
| Daily Pivot Point R3 | 1.3442 |
[/s2If]
Nehcap Expert Advisor
The NEHCAP MT4 EA is high quality professional trading system geared to generate returns without using GRID or martingales. Each trade has strict risk per trade parameter. The pairs under management include EURUSD, GBPUSD, AUDCAD, AUDNZD,GBPAUD, EURAUD, EURCAD, CHFJPY and many more.
The system is trading live: LIVE ACCOUNT TRACKING
You can run it free. Apply for a free trial and track our account. Buy the system or use profit share mechanism to generate returns on your MT4.
Join Our Telegram Group
")


