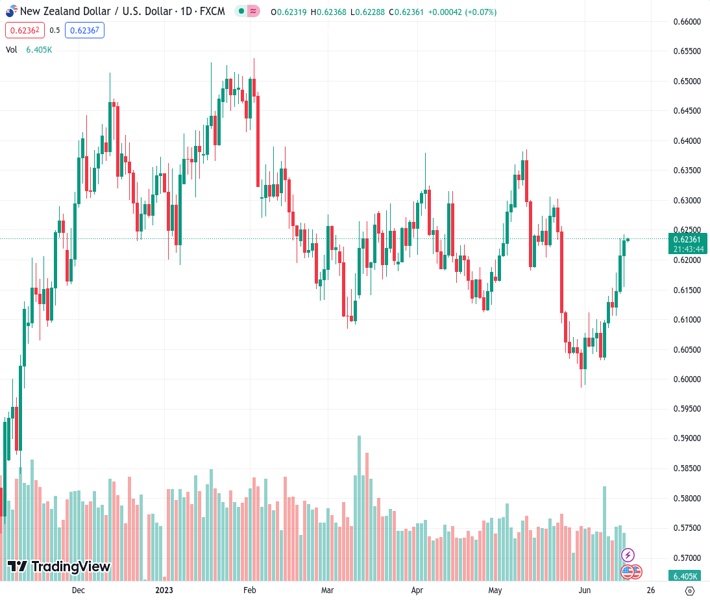
The NZDUSD pair, which previously reached a three-week high at 0.62300, has experienced its first daily decline in four days. However, according to the opinion of @nehcap, the potential decrease is expected to be minimal.
…
This is a premium post.
[s2If !current_user_can(access_s2member_level4)]Please register for FREE REGISTER to read full post below containing analysis. In case of any error or you think you are not able to read the full post below, please email us at support#nehcap.com [lwa][/s2If] [s2If current_user_can(access_s2member_level1)]
- NZD/USD eases from three-week high to print the first daily loss, so far, in four days.
The pair currently trades last at 0.62300.
The previous day high was 0.6236 while the previous day low was 0.6133. The daily 38.2% Fib levels comes at 0.6197, expected to provide support. Similarly, the daily 61.8% fib level is at 0.6173, expected to provide support.
NZD/USD takes offers to refresh intraday low around 0.6230 amid the early hours of Friday’s Asian session. In doing so, the Kiwi pair takes a U-turn from the highest levels since May 24, marked the previous day, while also snapping a three-day uptrend, amid downbeat New Zealand (NZ) data.
NZ Business PMI for June came in at 48.9 versus 50.2 expected and 49.1 prior. With this, the Pacific nation’s activity gauge marked the third consecutive monthly contraction in business performance.
Not only the downbeat NZ data but the above 50.0 levels of the RSI (14) line also allowed the NZD/USD bulls to take a breather at the multi-day high.
However, the 100-DMA support of around 0.6220 joins the bullish MACD signals to put a floor under the NZD/USD price for intraday traders, a break of which can quickly drag the quote to the 38.2% Fibonacci retracement of October 2022 to February 2023 upside, near 0.6150.
Following that, the resistance-turned-support line stretched from early May, around 0.6120 at the latest, will be in the spotlight.
In a case where the NZD/USD drops below 0.6120 support, the odds of witnessing a south-run towards the previous monthly low of around 0.5985 can’t be ruled out.
Meanwhile, the NZD/USD buyers can aim for the 23.6% Fibonacci retracement level of around 0.6300 on crossing the latest peak of 0.6250.
Though, a 4.5-month-old resistance line and a horizontal area comprising multiple levels marked since early February, respectively near 0.6330 and 0.6385-90, appear tough nuts to crack for the Kiwi pair buyers to keep the reins afterward.
Trend: Limited downside expected
Technical Levels: Supports and Resistances
NZDUSD currently trading at 0.6232 at the time of writing. Pair opened at 0.6206 and is trading with a change of 0.42% % .
| Overview | Overview.1 | |
|---|---|---|
| 0 | Today last price | 0.6232 |
| 1 | Today Daily Change | 0.0026 |
| 2 | Today Daily Change % | 0.42% |
| 3 | Today daily open | 0.6206 |
The pair remains strongly bullish on the daily timeframe. It trades above its 20 SMA @ 0.6113, 50 SMA 0.6179, 100 SMA @ 0.6224 and 200 SMA @ 0.615.
| Trends | Trends.1 | |
|---|---|---|
| 0 | Daily SMA20 | 0.6113 |
| 1 | Daily SMA50 | 0.6179 |
| 2 | Daily SMA100 | 0.6224 |
| 3 | Daily SMA200 | 0.6150 |
The previous day high was 0.6236 while the previous day low was 0.6133. The daily 38.2% Fib levels comes at 0.6197, expected to provide support. Similarly, the daily 61.8% fib level is at 0.6173, expected to provide support.
Note the levels of interest below:
- Pivot support is noted at 0.6147, 0.6089, 0.6044
- Pivot resistance is noted at 0.6251, 0.6295, 0.6354
| Levels | Levels.1 |
|---|---|
| Previous Daily High | 0.6236 |
| Previous Daily Low | 0.6133 |
| Previous Weekly High | 0.6143 |
| Previous Weekly Low | 0.6026 |
| Previous Monthly High | 0.6385 |
| Previous Monthly Low | 0.5985 |
| Daily Fibonacci 38.2% | 0.6197 |
| Daily Fibonacci 61.8% | 0.6173 |
| Daily Pivot Point S1 | 0.6147 |
| Daily Pivot Point S2 | 0.6089 |
| Daily Pivot Point S3 | 0.6044 |
| Daily Pivot Point R1 | 0.6251 |
| Daily Pivot Point R2 | 0.6295 |
| Daily Pivot Point R3 | 0.6354 |
[/s2If]
Nehcap Expert Advisor
The NEHCAP MT4 EA is high quality professional trading system geared to generate returns without using GRID or martingales. Each trade has strict risk per trade parameter. The pairs under management include EURUSD, GBPUSD, AUDCAD, AUDNZD,GBPAUD, EURAUD, EURCAD, CHFJPY and many more.
The system is trading live: LIVE ACCOUNT TRACKING
You can run it free. Apply for a free trial and track our account. Buy the system or use profit share mechanism to generate returns on your MT4.
Join Our Telegram Group
")


