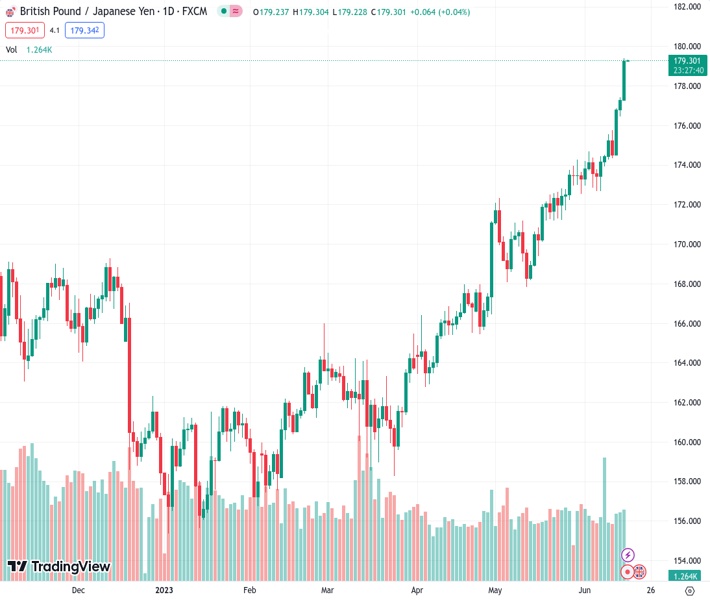
The GBPJPY pair soared to a level not seen since December 2015, reaching a multi-year peak of 179.40 on Thursday.
…
This is a premium post.
[s2If !current_user_can(access_s2member_level4)]Please register for FREE REGISTER to read full post below containing analysis. In case of any error or you think you are not able to read the full post below, please email us at support#nehcap.com [lwa][/s2If] [s2If current_user_can(access_s2member_level1)]
- On Thursday, the GBP/JPY rocketed to a multi-year high of 179.40 for the first time since December 2015.
The pair currently trades last at 179.256.
The previous day high was 177.44 while the previous day low was 176.45. The daily 38.2% Fib levels comes at 177.06, expected to provide support. Similarly, the daily 61.8% fib level is at 176.82, expected to provide support.
The GBP/JPY gained more than 100 pips on Thursday, rallying to a high of 179.40 and then stabilizing at the 179.30 zone. In that sense, the GBP seems to be gaining ground on the back of hawkish bets on the Bank of England (BoE) after strong labour-market and Gross Domestic Product (GDP) data which supports more rate hikes. On the other hand, policy divergence seems to be weakening the Yen ahead of the Bank of Japan (BoJ) meeting on Friday.
Along this week, labour-market data from the UK showed that unemployment decreased in the three months period to April while average earnings, including and excluding bonuses, accelerated during the same period. In addition, monthly GDP expanded by 0.2% in April after a decline in March while growing by 0.1% in the three months to April.
As the labour market remains robust and economic activity resilient, investors are expecting that the BoE will take a more aggressive path in its fight for inflation. In that sense, according to WIRP (World Interest Rate Probability), the market suggests that a 25 bps hike to 4.75% is already priced in. Meanwhile, the British yields rose across the curve. The 10-year bond yield rose to 4.41%, while the 2-year yield stood at 4.93% and the 5-year yielded 4.56%, respectively.
According to the daily chart, the GBP/JPY holds a bullish outlook for the short term, but the cross trading in multi-year highs and at overbought conditions signalled by the Relative Strength Index (RSI) suggest that a healthy downward correction may be on the horizon.
In case the pair continues to gain traction, the following resistance line up at the 179.50 area, followed then by the psychological mark at 180.00 and the 180.50 zone. On the other hand, if the pair corrects to the downside, immediate support levels are seen at the 177.40 area, followed by the psychological mark at 175.00 and the 20-day Simple Moving Average (SMA) at 174.05.
Technical Levels: Supports and Resistances
GBPJPY currently trading at 179.32 at the time of writing. Pair opened at 177.38 and is trading with a change of 1.09 % .
| Overview | Overview.1 | |
|---|---|---|
| 0 | Today last price | 179.32 |
| 1 | Today Daily Change | 1.94 |
| 2 | Today Daily Change % | 1.09 |
| 3 | Today daily open | 177.38 |
The pair remains strongly bullish on the daily timeframe. It trades above its 20 SMA @ 173.77, 50 SMA 170.36, 100 SMA @ 166.02 and 200 SMA @ 164.97.
| Trends | Trends.1 | |
|---|---|---|
| 0 | Daily SMA20 | 173.77 |
| 1 | Daily SMA50 | 170.36 |
| 2 | Daily SMA100 | 166.02 |
| 3 | Daily SMA200 | 164.97 |
The previous day high was 177.44 while the previous day low was 176.45. The daily 38.2% Fib levels comes at 177.06, expected to provide support. Similarly, the daily 61.8% fib level is at 176.82, expected to provide support.
Note the levels of interest below:
- Pivot support is noted at 176.74, 176.1, 175.75
- Pivot resistance is noted at 177.73, 178.07, 178.71
| Levels | Levels.1 |
|---|---|
| Previous Daily High | 177.44 |
| Previous Daily Low | 176.45 |
| Previous Weekly High | 175.54 |
| Previous Weekly Low | 172.67 |
| Previous Monthly High | 174.28 |
| Previous Monthly Low | 167.84 |
| Daily Fibonacci 38.2% | 177.06 |
| Daily Fibonacci 61.8% | 176.82 |
| Daily Pivot Point S1 | 176.74 |
| Daily Pivot Point S2 | 176.10 |
| Daily Pivot Point S3 | 175.75 |
| Daily Pivot Point R1 | 177.73 |
| Daily Pivot Point R2 | 178.07 |
| Daily Pivot Point R3 | 178.71 |
[/s2If]
Nehcap Expert Advisor
The NEHCAP MT4 EA is high quality professional trading system geared to generate returns without using GRID or martingales. Each trade has strict risk per trade parameter. The pairs under management include EURUSD, GBPUSD, AUDCAD, AUDNZD,GBPAUD, EURAUD, EURCAD, CHFJPY and many more.
The system is trading live: LIVE ACCOUNT TRACKING
You can run it free. Apply for a free trial and track our account. Buy the system or use profit share mechanism to generate returns on your MT4.
Join Our Telegram Group
")


