The Euro to British Pound exchange rate has experienced slight increases, currently trading at 0.8562, following the European Central Bank’s decision to increase its interest rate by 25 basis points.
…
This is a premium post.
[s2If !current_user_can(access_s2member_level4)]Please register for FREE REGISTER to read full post below containing analysis. In case of any error or you think you are not able to read the full post below, please email us at support#nehcap.com [lwa][/s2If] [s2If current_user_can(access_s2member_level1)]
- EUR/GBP sees modest gains, trading at 0.8562, following ECB’s 25 bps rate hike.
The pair currently trades last at 0.85594.
The previous day high was 0.8563 while the previous day low was 0.8541. The daily 38.2% Fib levels comes at 0.8549, expected to provide support. Similarly, the daily 61.8% fib level is at 0.8554, expected to provide support.
EUR/GBP trades with modest gains after the European Central Bank (ECB) raised rates by 25 basis points (bps) and telegraphed additional increases. However, expectations of further tightening by the Bank of England (BoE) capped the Euro’s (EUR) rally at 0.8591, recovering ground after Wall Street closed. At the time of writing, the EUR/GBP is trading at 0.8562, up 0.13%.
On Thursday, the European Central Bank (ECB) raised rates by 25 bps as expected, leaving the deposit rates at 2.50%, its highest level in 22 years. Besides increasing rates, the ECB staff revised inflation prospected to the upside, from 4.6% to 5.1%.
In the meantime, ECB President Christine Lagarde cemented the case for a rate hike in July but pushed back against expectations for a September increase. Lagarde added, “Wage pressures, while partly reflecting one-off payments, are becoming an increasingly important source of inflation.”
Even though inflation cooled somewhat, it is still three times the ECB’s goal of 6.1%. It should be said that prices have come down at the expense of slow economic growth, as recent GDP reports from the bloc suggest the economy hit a recession. Back-to-back negative quarters revealed that growth was cut to -0.1% in Q4 2022 and Q1 2023.
Aside from this, expectations for a hawkish Bank of England (BoE) capped the Euro’s gains, which was set to challenge the 0.86 handle. Nevertheless, money market futures estimates for the BoE to raise rates at least 100 bps in the next twelve months spurred an appreciation in the Sterling (GBP), which posted solid gains against the US Dollar.
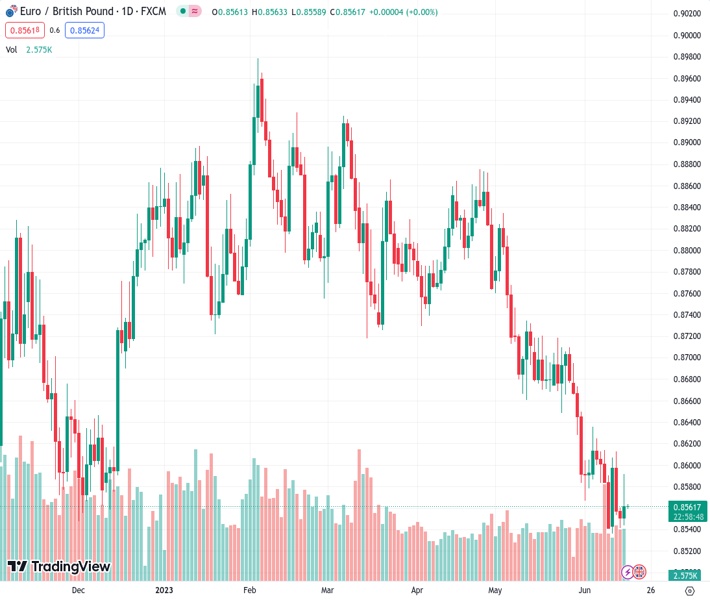
From a daily chart perspective, the EUR/GBP is tilted downwards, but since June 9, when it hit a low of 0.8540, the cross failed to extend its losses past the new year-to-date (YTD) low of 0.8536. since then, the EUR/GBP has been exchanging hands in a 70-pip range capped by the 20-day Exponential Moving Average (EMA) on the upside at 0.8610. Nevertheless, the ongoing downtrend started in February is still in place, and the path of least resistance is downwards.
The EUR/GBP first support would be the 0.8541, June 14 low. A breach of the latter will expose the YTD low of 0.8536 before dropping toward 0.8500. Upward risks lie above 0.8600, particularly at the 20-day EMA, followed by resistance at the 50-day EMA at 0.8677.
Technical Levels: Supports and Resistances
EURGBP currently trading at 0.8561 at the time of writing. Pair opened at 0.8555 and is trading with a change of 0.07 % .
| Overview | Overview.1 | |
|---|---|---|
| 0 | Today last price | 0.8561 |
| 1 | Today Daily Change | 0.0006 |
| 2 | Today Daily Change % | 0.0700 |
| 3 | Today daily open | 0.8555 |
The pair remains strongly bearish on the daily time frame. It trades below the 20 SMA @ 0.8629, 50 SMA 0.8719, 100 SMA @ 0.8775 and 200 SMA @ 0.8754.
| Trends | Trends.1 | |
|---|---|---|
| 0 | Daily SMA20 | 0.8629 |
| 1 | Daily SMA50 | 0.8719 |
| 2 | Daily SMA100 | 0.8775 |
| 3 | Daily SMA200 | 0.8754 |
The previous day high was 0.8563 while the previous day low was 0.8541. The daily 38.2% Fib levels comes at 0.8549, expected to provide support. Similarly, the daily 61.8% fib level is at 0.8554, expected to provide support.
Note the levels of interest below:
- Pivot support is noted at 0.8543, 0.8531, 0.8522
- Pivot resistance is noted at 0.8565, 0.8574, 0.8586
| Levels | Levels.1 |
|---|---|
| Previous Daily High | 0.8563 |
| Previous Daily Low | 0.8541 |
| Previous Weekly High | 0.8636 |
| Previous Weekly Low | 0.8541 |
| Previous Monthly High | 0.8835 |
| Previous Monthly Low | 0.8583 |
| Daily Fibonacci 38.2% | 0.8549 |
| Daily Fibonacci 61.8% | 0.8554 |
| Daily Pivot Point S1 | 0.8543 |
| Daily Pivot Point S2 | 0.8531 |
| Daily Pivot Point S3 | 0.8522 |
| Daily Pivot Point R1 | 0.8565 |
| Daily Pivot Point R2 | 0.8574 |
| Daily Pivot Point R3 | 0.8586 |
[/s2If]
Nehcap Expert Advisor
The NEHCAP MT4 EA is high quality professional trading system geared to generate returns without using GRID or martingales. Each trade has strict risk per trade parameter. The pairs under management include EURUSD, GBPUSD, AUDCAD, AUDNZD,GBPAUD, EURAUD, EURCAD, CHFJPY and many more.
The system is trading live: LIVE ACCOUNT TRACKING
You can run it free. Apply for a free trial and track our account. Buy the system or use profit share mechanism to generate returns on your MT4.
Join Our Telegram Group
")


