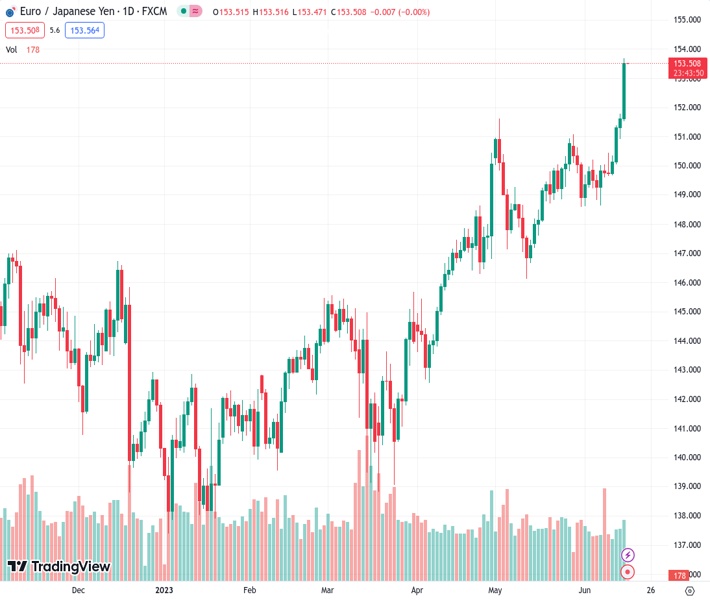
EURJPY has broken through 153.50 level for the first time in over a decade, currently trading at 153.530.
…
This is a premium post.
[s2If !current_user_can(access_s2member_level4)]Please register for FREE REGISTER to read full post below containing analysis. In case of any error or you think you are not able to read the full post below, please email us at support#nehcap.com [lwa][/s2If] [s2If current_user_can(access_s2member_level1)]
- EUR/JPY pierces through 153.50 for the first time since 2008.
The pair currently trades last at 153.530.
The previous day high was 151.78 while the previous day low was 150.92. The daily 38.2% Fib levels comes at 151.45, expected to provide support. Similarly, the daily 61.8% fib level is at 151.25, expected to provide support.
The EUR/JPY sets four-day winning strike trading at 153.55 as the Euro rallied against most of its rivals on Thursday following the European Central Bank (ECB) meeting. In that sense, Christine Lagarde’s hawkish comments in the presser hinting at more hikes, fueled the Euro’s rally.
On Thursday, the ECB increased the main financing rate to 4.00%, the marginal lending to 4.25% and the deposit facility rate to 3.50%, all by 25 basis points as expected. Regarding the updated macroeconomic forecast, the central bank expects the Gross Domestic Product (GDP) to pick up later this year. They consider inflation will remain high, at least until 2025.
Looking forward, Christine Lagarde mentioned in the presser, that they are “not done yet”, and that there is still “more ground to cover”, stating that she is not satisfied with the progress being made. In relation to the recent deceleration of inflationary pressures in the Eurozone (EZ), she considered it as “broad-based” and that the central bank should focus on the long-term inflation expectations. All in all, she also confirmed that it is “very likely” that the ECB will hike again in July.
As a reaction, the German yields rose across the curve. The 10-year bond yield climbed to 2.46%, seeing a daily increase of 1.34%, while the 2-year yield stands at 3.13%, gaining 2.80%.
On the other hand, investors await the Bank of Japan (BoJ) decision on Friday. The central bank is expected to keep its monetary policy unchanged.
Based on the daily chart, the EUR/JPY holds a clear bullish bias in the short term, as the Relative Strength Index (RSI) and Moving Average Convergence Divergence (MACD) are both deep in positive territory, suggesting a strong upward momentum. However, the pair reached overbought conditions and uncharted territory, suggesting that a downward correction may be on the horizon.
If EUR/JPY manages to move higher, the next resistances to watch are at the 153.80 area, followed by the psychological mark at 154.00 and the 154.50 zone. On the other hand, in case the cross loses ground, support levels line up at the psychological mark at 152.00,the 150.50 area and the 20-day Simple Moving Average (SMA) at 150.05.
Technical Levels: Supports and Resistances
EURJPY currently trading at 153.55 at the time of writing. Pair opened at 151.7 and is trading with a change of 1.22 % .
| Overview | Overview.1 | |
|---|---|---|
| 0 | Today last price | 153.55 |
| 1 | Today Daily Change | 1.85 |
| 2 | Today Daily Change % | 1.22 |
| 3 | Today daily open | 151.70 |
The pair remains strongly bullish on the daily timeframe. It trades above its 20 SMA @ 149.93, 50 SMA 148.49, 100 SMA @ 145.64 and 200 SMA @ 144.39.
| Trends | Trends.1 | |
|---|---|---|
| 0 | Daily SMA20 | 149.93 |
| 1 | Daily SMA50 | 148.49 |
| 2 | Daily SMA100 | 145.64 |
| 3 | Daily SMA200 | 144.39 |
The previous day high was 151.78 while the previous day low was 150.92. The daily 38.2% Fib levels comes at 151.45, expected to provide support. Similarly, the daily 61.8% fib level is at 151.25, expected to provide support.
Note the levels of interest below:
- Pivot support is noted at 151.15, 150.61, 150.29
- Pivot resistance is noted at 152.02, 152.33, 152.88
| Levels | Levels.1 |
|---|---|
| Previous Daily High | 151.78 |
| Previous Daily Low | 150.92 |
| Previous Weekly High | 150.44 |
| Previous Weekly Low | 148.63 |
| Previous Monthly High | 151.62 |
| Previous Monthly Low | 146.14 |
| Daily Fibonacci 38.2% | 151.45 |
| Daily Fibonacci 61.8% | 151.25 |
| Daily Pivot Point S1 | 151.15 |
| Daily Pivot Point S2 | 150.61 |
| Daily Pivot Point S3 | 150.29 |
| Daily Pivot Point R1 | 152.02 |
| Daily Pivot Point R2 | 152.33 |
| Daily Pivot Point R3 | 152.88 |
[/s2If]
Nehcap Expert Advisor
The NEHCAP MT4 EA is high quality professional trading system geared to generate returns without using GRID or martingales. Each trade has strict risk per trade parameter. The pairs under management include EURUSD, GBPUSD, AUDCAD, AUDNZD,GBPAUD, EURAUD, EURCAD, CHFJPY and many more.
The system is trading live: LIVE ACCOUNT TRACKING
You can run it free. Apply for a free trial and track our account. Buy the system or use profit share mechanism to generate returns on your MT4.
Join Our Telegram Group
")


