At the price of $23.874, the XAGUSD is facing a barrier and currently trading at $23.82, down by 0.36% due to a decrease in the US Treasury yields.
…
This is a premium post.
[s2If !current_user_can(access_s2member_level4)]Please register for FREE REGISTER to read full post below containing analysis. In case of any error or you think you are not able to read the full post below, please email us at support#nehcap.com [lwa][/s2If] [s2If current_user_can(access_s2member_level1)]
- XAG/USD sees resistance, trading at $23.82, down 0.36% amidst weakened US Treasury yields.
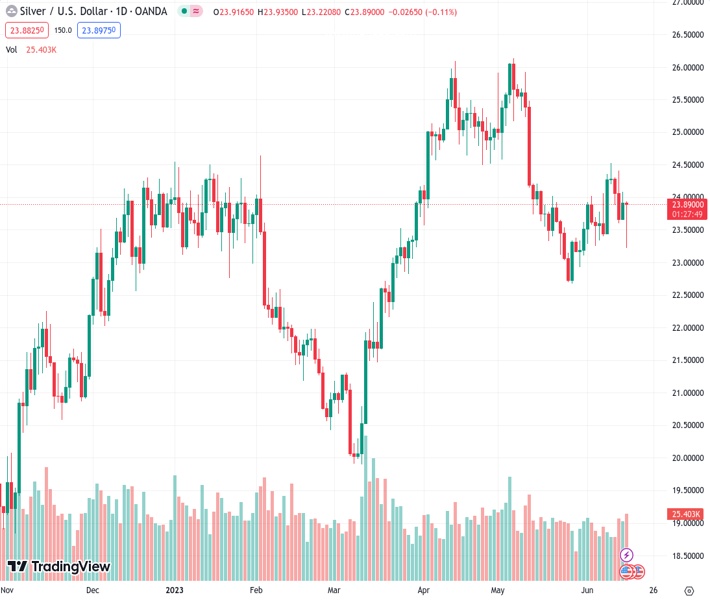
The pair currently trades last at 23.874.
The previous day high was 24.08 while the previous day low was 23.66. The daily 38.2% Fib levels comes at 23.92, expected to provide resistance. Similarly, the daily 61.8% fib level is at 23.82, expected to provide support.
Silver price erases some of its earlier losses which witnesses XAG/USD’s printing a two-week low at $23.22 before reversing its direction. However, XAG/USD’s recovery stalled at a resistance area, with several technical indicators capping the uptrend. At the time of writing, the XAG/USD is trading at $23.82, down 0.36%.
The XAG/USD remains neutrally biased, tilted downwards as the white metal can’t reclaim the April 25 swing low of $24.49, an inflection point that can pave the way for further upside. Should be said Silver failed to rally, despite a drop in US Treasury bond yields. Therefore, XAG/USD’s momentum in the short term could be fading, warranting a bearish resumption.
To the downside, XAG/USD would find first support at the 100-day Exponential Moving Average (EMA) at $23.53, which, once cleared, would put at risk $23.00. Break below, and the 200-day EMA will be up for grabs at $22.94 before challenging May 26 low at $22.68, with further downside expected past the latter.
Conversely, the XAG/USD must crack the June 9 daily high for a bullish resumption at $24.52. The break above will put into play a higher trading range and shift Silver’s bias to neutral upwards. The next resistance would be $25.00, followed by May 11 high at $25.47.
However, oscillators suggest further downside expected in the near term, with the Relative Strength Index (RSI) at a bearish area and the three-day Rate of Change (RoC), portraying sellers remaining in control.
Technical Levels: Supports and Resistances
XAGUSD currently trading at 23.86 at the time of writing. Pair opened at 23.93 and is trading with a change of -0.29 % .
| Overview | Overview.1 | |
|---|---|---|
| 0 | Today last price | 23.86 |
| 1 | Today Daily Change | -0.07 |
| 2 | Today Daily Change % | -0.29 |
| 3 | Today daily open | 23.93 |
The pair is trading above its 20 Daily moving average @ 23.59, below its 50 Daily moving average @ 24.47 , above its 100 Daily moving average @ 23.36 and above its 200 Daily moving average @ 22.35
| Trends | Trends.1 | |
|---|---|---|
| 0 | Daily SMA20 | 23.59 |
| 1 | Daily SMA50 | 24.47 |
| 2 | Daily SMA100 | 23.36 |
| 3 | Daily SMA200 | 22.35 |
The previous day high was 24.08 while the previous day low was 23.66. The daily 38.2% Fib levels comes at 23.92, expected to provide resistance. Similarly, the daily 61.8% fib level is at 23.82, expected to provide support.
Note the levels of interest below:
- Pivot support is noted at 23.7, 23.46, 23.27
- Pivot resistance is noted at 24.12, 24.32, 24.55
| Levels | Levels.1 |
|---|---|
| Previous Daily High | 24.08 |
| Previous Daily Low | 23.66 |
| Previous Weekly High | 24.53 |
| Previous Weekly Low | 23.25 |
| Previous Monthly High | 26.14 |
| Previous Monthly Low | 22.68 |
| Daily Fibonacci 38.2% | 23.92 |
| Daily Fibonacci 61.8% | 23.82 |
| Daily Pivot Point S1 | 23.70 |
| Daily Pivot Point S2 | 23.46 |
| Daily Pivot Point S3 | 23.27 |
| Daily Pivot Point R1 | 24.12 |
| Daily Pivot Point R2 | 24.32 |
| Daily Pivot Point R3 | 24.55 |
[/s2If]
Nehcap Expert Advisor
The NEHCAP MT4 EA is high quality professional trading system geared to generate returns without using GRID or martingales. Each trade has strict risk per trade parameter. The pairs under management include EURUSD, GBPUSD, AUDCAD, AUDNZD,GBPAUD, EURAUD, EURCAD, CHFJPY and many more.
The system is trading live: LIVE ACCOUNT TRACKING
You can run it free. Apply for a free trial and track our account. Buy the system or use profit share mechanism to generate returns on your MT4.
Join Our Telegram Group
")


