The USDINR has managed to hold onto slight gains during its first daily increase in four. However, Nehcap predicts that there will be only minor further increases.
…
This is a premium post.
[s2If !current_user_can(access_s2member_level4)]Please register for FREE REGISTER to read full post below containing analysis. In case of any error or you think you are not able to read the full post below, please email us at support#nehcap.com [lwa][/s2If] [s2If current_user_can(access_s2member_level1)]
- USD/INR clings to mild gains during the first daily run-up in four.
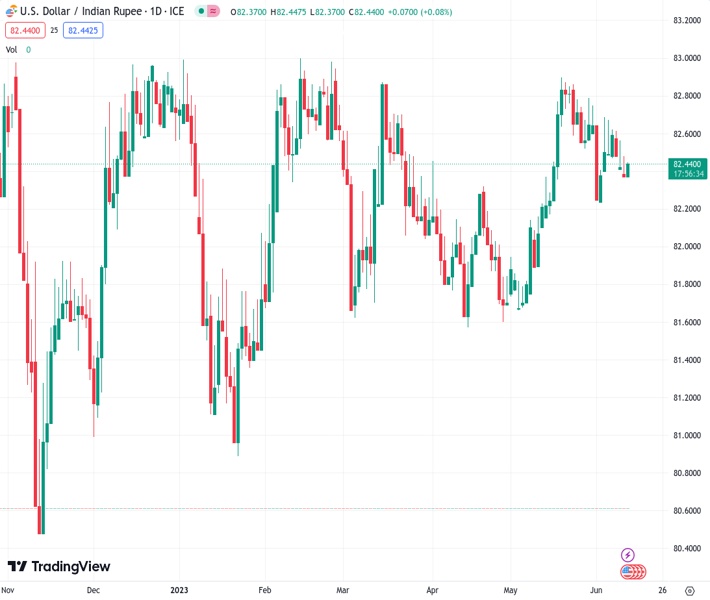
The pair currently trades last at 82.4300.
The previous day high was 82.568 while the previous day low was 82.3355. The daily 38.2% Fib levels comes at 82.4243, expected to provide support. Similarly, the daily 61.8% fib level is at 82.4792, expected to provide resistance.
USD/INR prints mild gains around 82.45 as it extends the early-day rebound from the short-term key support confluence heading into Tuesday’s European session. In doing so, the Indian Rupee (INR) pair justifies downbeat India Consumer Price Index (CPI) data ahead of US inflation releases.
That said, India’s CPI eased to 4.25% in May versus 4.42% expected and 4.70% prior, which in turn justifies the Reserve Bank of India’s (RBA) latest pause in rate hike and suggests some more inactions to come from the Indian central bank. On the other hand, the early signals for the US inflation numbers have been downbeat and hence prod the USD/INR bulls.
Also read: US Inflation Preview: Why the US Dollar is more likely to fall than rise, three scenarios
Technically, the USD/INR pair bounces off a convergence of the 200-SMA and the lower line of a one-month-old symmetrical triangle, around 82.33 by the press time.
The recovery moves also take clues from the RSI (14) line’s rebound from the oversold territory, suggesting further weakness of the Indian Rupee (INR).
Hence, the USD/INR price is likely to rise towards the short-term key upside hurdle of 82.60 comprising the 100-SMA and top line of the aforementioned triangle.
It should be noted, however, that the USD/INR pair’s run-up beyond 82.60 won’t hesitate to challenge the previous monthly high of around 83.00 whereas a downside break of 82.33 needs validation from the mid-May swing low of around 82.15 to convince the pair sellers.
Trend: Limited upside expected
Technical Levels: Supports and Resistances
USDINR currently trading at 82.399 at the time of writing. Pair opened at 82.3435 and is trading with a change of 0.07% % .
| Overview | Overview.1 | |
|---|---|---|
| 0 | Today last price | 82.399 |
| 1 | Today Daily Change | 0.0555 |
| 2 | Today Daily Change % | 0.07% |
| 3 | Today daily open | 82.3435 |
The pair is trading below its 20 Daily moving average @ 82.5794, above its 50 Daily moving average @ 82.1969 , above its 100 Daily moving average @ 82.262 and above its 200 Daily moving average @ 82.004
| Trends | Trends.1 | |
|---|---|---|
| 0 | Daily SMA20 | 82.5794 |
| 1 | Daily SMA50 | 82.1969 |
| 2 | Daily SMA100 | 82.2620 |
| 3 | Daily SMA200 | 82.0040 |
The previous day high was 82.568 while the previous day low was 82.3355. The daily 38.2% Fib levels comes at 82.4243, expected to provide support. Similarly, the daily 61.8% fib level is at 82.4792, expected to provide resistance.
Note the levels of interest below:
- Pivot support is noted at 82.2633, 82.1831, 82.0308
- Pivot resistance is noted at 82.4959, 82.6482, 82.7284
| Levels | Levels.1 |
|---|---|
| Previous Daily High | 82.5680 |
| Previous Daily Low | 82.3355 |
| Previous Weekly High | 82.7120 |
| Previous Weekly Low | 82.4030 |
| Previous Monthly High | 82.9810 |
| Previous Monthly Low | 81.6435 |
| Daily Fibonacci 38.2% | 82.4243 |
| Daily Fibonacci 61.8% | 82.4792 |
| Daily Pivot Point S1 | 82.2633 |
| Daily Pivot Point S2 | 82.1831 |
| Daily Pivot Point S3 | 82.0308 |
| Daily Pivot Point R1 | 82.4959 |
| Daily Pivot Point R2 | 82.6482 |
| Daily Pivot Point R3 | 82.7284 |
[/s2If]
Nehcap Expert Advisor
The NEHCAP MT4 EA is high quality professional trading system geared to generate returns without using GRID or martingales. Each trade has strict risk per trade parameter. The pairs under management include EURUSD, GBPUSD, AUDCAD, AUDNZD,GBPAUD, EURAUD, EURCAD, CHFJPY and many more.
The system is trading live: LIVE ACCOUNT TRACKING
You can run it free. Apply for a free trial and track our account. Buy the system or use profit share mechanism to generate returns on your MT4.
Join Our Telegram Group
")


