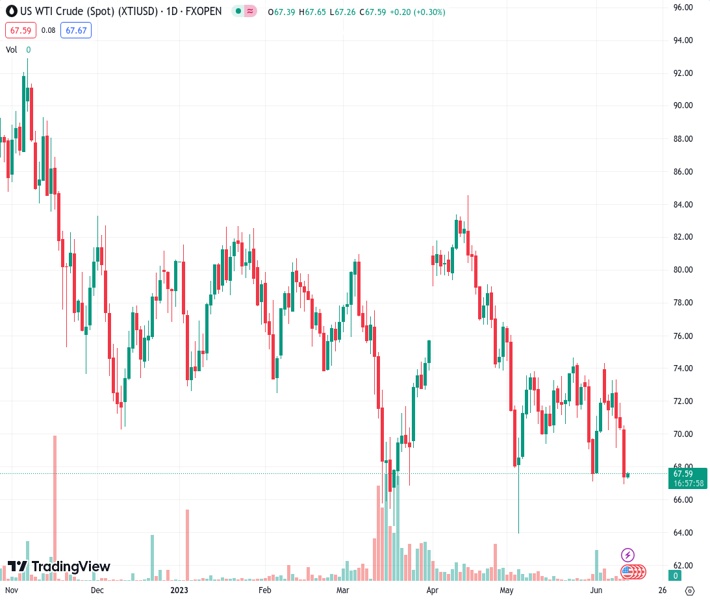
The lowest levels of WTI crude oil in five weeks saw a reduction of its greatest daily loss in two weeks.
…
This is a premium post.
[s2If !current_user_can(access_s2member_level4)]Please register for FREE REGISTER to read full post below containing analysis. In case of any error or you think you are not able to read the full post below, please email us at support#nehcap.com [lwa][/s2If] [s2If current_user_can(access_s2member_level1)]
- WTI crude oil pares the biggest daily loss in a fortnight at the lowest levels in five weeks.
The pair currently trades last at 67.64.
The previous day high was 70.58 while the previous day low was 66.95. The daily 38.2% Fib levels comes at 68.34, expected to provide resistance. Similarly, the daily 61.8% fib level is at 69.19, expected to provide resistance.
WTI crude oil picks up bids to print mild gains around $67.70 as it consolidates the biggest daily slump in two weeks amid early Tuesday. In doing so, the black gold recovers from the lowest levels since early May amid sluggish markets.
That said, the US Dollar’s weakness takes clues from the market’s heavy bets on the Federal Reserve’s (Fed) inaction during Federal Open Market Committee (FOMC). That said, the CME’s FedWatch Tool suggests more than 70% chance of the Fed’s inaction on Wednesday while suggesting nearly 80% odds favoring the 0.25% rate increase in July.
Even so, fears of witnessing a hawkish halt from the US Federal Reserve (Fed) and cautious mood before today’s US Consumer Price Index (CPI) figures for May prod the market sentiment, as well as weigh on the Oil price. Recently, Former Dallas Federal Reserve Bank (Fed) President Robert Kaplan said in an interview that he would support a “hawkish pause” at this week’s meeting. Previously, ex-Fed vice chair Richard Clarida came out with comments that it may be more difficult to get inflation near 2% than in the past 15 years. Further, “Expect a hawkish skip this week,” Former President of Boston Federal Reserve Bank, Eric Rosengren, tweeted early Monday.
Additionally, fears that China is losing economic momentum also weigh on the WTI price as Beijing is one of the world’s biggest energy consumers. People’s Bank of China (PBoC) cuts the Repo Rate to 1.9% from 2.0% and confirms the previous fears suggesting slower economic growth in the world’s biggest industrial player. With this in mind, Bloomberg said, “China’s central bank cut a short-term policy interest rate, easing its monetary stance to help aid the economy’s recovery.”
Additionally, the market’s fears of more tension between the US and China escalate as the US expands its ban on imports from Xinjiang. China vows to protect China firms against any US sanctions, per Reuters. Recently, Bloomberg released prepared remarks of US Treasury Secretary Janet Yellen’s scheduled Testimony in front of the House Financial Services Committee as she said that the International Monetary Fund (IMF) and the World Bank (WB) serve as important counterweights to non-transparent, unsustainable lending from others, like China.
Looking ahead, the US CPI data for May and private Oil inventory data from the American Petroleum Institute (API) will be important to watch for energy traders.
WTI crude oil’s recovery remains elusive unless the quote rises past the previous support line stretched from early May, around $68.40 by the press time.
Technical Levels: Supports and Resistances
XTIUSD currently trading at 67.64 at the time of writing. Pair opened at 67.48 and is trading with a change of 0.24% % .
| Overview | Overview.1 | |
|---|---|---|
| 0 | Today last price | 67.64 |
| 1 | Today Daily Change | 0.16 |
| 2 | Today Daily Change % | 0.24% |
| 3 | Today daily open | 67.48 |
The pair remains strongly bearish on the daily time frame. It trades below the 20 SMA @ 71.46, 50 SMA 74.5, 100 SMA @ 75.14 and 200 SMA @ 78.48.
| Trends | Trends.1 | |
|---|---|---|
| 0 | Daily SMA20 | 71.46 |
| 1 | Daily SMA50 | 74.50 |
| 2 | Daily SMA100 | 75.14 |
| 3 | Daily SMA200 | 78.48 |
The previous day high was 70.58 while the previous day low was 66.95. The daily 38.2% Fib levels comes at 68.34, expected to provide resistance. Similarly, the daily 61.8% fib level is at 69.19, expected to provide resistance.
Note the levels of interest below:
- Pivot support is noted at 66.1, 64.71, 62.47
- Pivot resistance is noted at 69.72, 71.96, 73.34
| Levels | Levels.1 |
|---|---|
| Previous Daily High | 70.58 |
| Previous Daily Low | 66.95 |
| Previous Weekly High | 74.36 |
| Previous Weekly Low | 69.17 |
| Previous Monthly High | 76.61 |
| Previous Monthly Low | 64.31 |
| Daily Fibonacci 38.2% | 68.34 |
| Daily Fibonacci 61.8% | 69.19 |
| Daily Pivot Point S1 | 66.10 |
| Daily Pivot Point S2 | 64.71 |
| Daily Pivot Point S3 | 62.47 |
| Daily Pivot Point R1 | 69.72 |
| Daily Pivot Point R2 | 71.96 |
| Daily Pivot Point R3 | 73.34 |
[/s2If]
Nehcap Expert Advisor
The NEHCAP MT4 EA is high quality professional trading system geared to generate returns without using GRID or martingales. Each trade has strict risk per trade parameter. The pairs under management include EURUSD, GBPUSD, AUDCAD, AUDNZD,GBPAUD, EURAUD, EURCAD, CHFJPY and many more.
The system is trading live: LIVE ACCOUNT TRACKING
You can run it free. Apply for a free trial and track our account. Buy the system or use profit share mechanism to generate returns on your MT4.
Join Our Telegram Group
")


