The GBPUSD pair, which stands at a rate of 1.25247, is receiving increased buying activity, reversing the decline from earlier in the week when it reached a monthly high. This has helped to minimize the largest daily decrease in over a week. Despite this development, there is only a limited possibility of significant gains.
…
This is a premium post.
[s2If !current_user_can(access_s2member_level4)]Please register for FREE REGISTER to read full post below containing analysis. In case of any error or you think you are not able to read the full post below, please email us at support#nehcap.com [lwa][/s2If] [s2If current_user_can(access_s2member_level1)]
- GBP/USD picks up bids to reverse the week-start retreat from monthly high, pares the biggest daily loss in over a week.
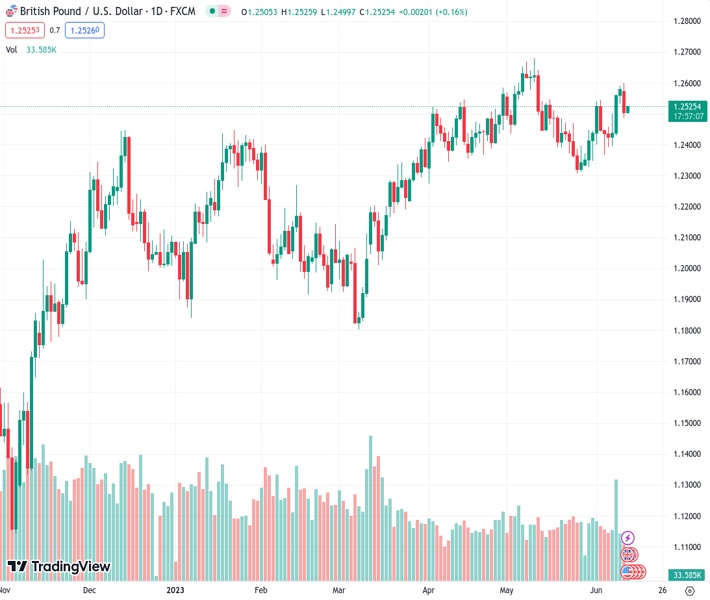
The pair currently trades last at 1.25247.
The previous day high was 1.2599 while the previous day low was 1.2487. The daily 38.2% Fib levels comes at 1.253, expected to provide resistance. Similarly, the daily 61.8% fib level is at 1.2557, expected to provide resistance.
GBP/USD clings to mild gains around 1.2520 as the Cable traders await the UK employment report on early Tuesday. In doing so, the Pound Sterling reverses the previous day’s pullback from the highest level in a month while consolidating the biggest daily loss in seven days.
That said, the 10-DMA level joins the bullish MACD signals to restrict short-term GBP/USD downside within a two-week-old rising channel. However, the UK’s job numbers and the US inflation data, as well as Wednesday’s Federal Open Market Committee (FOMC), appear more important catalysts to watch for clear directions.
Also read: GBP/USD trades with modest gains above 1.2500 mark ahead of UK jobs data, US CPI
Technically, the Cable pair’s rebound from the short-term DMA support of 1.2488 gains back-up from the upbeat oscillator to lure short-term buyers. However, the aforementioned bullish channel’s top line, close to 1.2610 at the latest, restricts the GBP/USD pair’s further upside.
It should be noted that multiple hurdles marked since late April also challenge the GBP/USD bulls around 1.2580.
Even if the pair buyers manage to defy the stated bullish channel formation by crossing the 1.2610 hurdle, the yearly top marked in May around 1.2680 appears the last defense of the bears.
On the contrary, a downside break of the 10-DMA can quickly fetch the GBP/USD price to the stated channel’s bottom line, close to 1.2430 as we write. However, an upward-sloping support line from early March, near 1.2420, holds the ticket for the seller’s entry.
Trend: Limited upside expected
Technical Levels: Supports and Resistances
GBPUSD currently trading at 1.2517 at the time of writing. Pair opened at 1.2505 and is trading with a change of 0.10% % .
| Overview | Overview.1 | |
|---|---|---|
| 0 | Today last price | 1.2517 |
| 1 | Today Daily Change | 0.0012 |
| 2 | Today Daily Change % | 0.10% |
| 3 | Today daily open | 1.2505 |
The pair remains strongly bullish on the daily timeframe. It trades above its 20 SMA @ 1.2442, 50 SMA 1.2471, 100 SMA @ 1.231 and 200 SMA @ 1.2021.
| Trends | Trends.1 | |
|---|---|---|
| 0 | Daily SMA20 | 1.2442 |
| 1 | Daily SMA50 | 1.2471 |
| 2 | Daily SMA100 | 1.2310 |
| 3 | Daily SMA200 | 1.2021 |
The previous day high was 1.2599 while the previous day low was 1.2487. The daily 38.2% Fib levels comes at 1.253, expected to provide resistance. Similarly, the daily 61.8% fib level is at 1.2557, expected to provide resistance.
Note the levels of interest below:
- Pivot support is noted at 1.2462, 1.2418, 1.2349
- Pivot resistance is noted at 1.2574, 1.2643, 1.2686
| Levels | Levels.1 |
|---|---|
| Previous Daily High | 1.2599 |
| Previous Daily Low | 1.2487 |
| Previous Weekly High | 1.2590 |
| Previous Weekly Low | 1.2369 |
| Previous Monthly High | 1.2680 |
| Previous Monthly Low | 1.2308 |
| Daily Fibonacci 38.2% | 1.2530 |
| Daily Fibonacci 61.8% | 1.2557 |
| Daily Pivot Point S1 | 1.2462 |
| Daily Pivot Point S2 | 1.2418 |
| Daily Pivot Point S3 | 1.2349 |
| Daily Pivot Point R1 | 1.2574 |
| Daily Pivot Point R2 | 1.2643 |
| Daily Pivot Point R3 | 1.2686 |
[/s2If]
Nehcap Expert Advisor
The NEHCAP MT4 EA is high quality professional trading system geared to generate returns without using GRID or martingales. Each trade has strict risk per trade parameter. The pairs under management include EURUSD, GBPUSD, AUDCAD, AUDNZD,GBPAUD, EURAUD, EURCAD, CHFJPY and many more.
The system is trading live: LIVE ACCOUNT TRACKING
You can run it free. Apply for a free trial and track our account. Buy the system or use profit share mechanism to generate returns on your MT4.
Join Our Telegram Group
")


