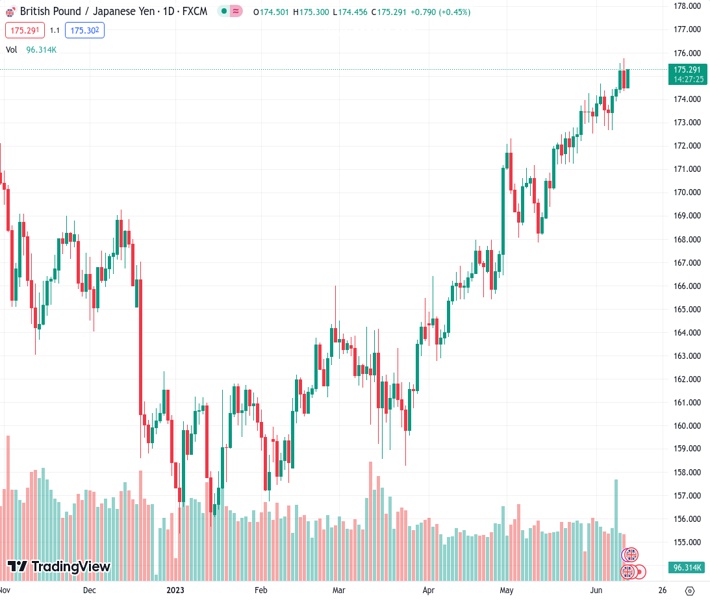
The GBPJPY currency pair, which stands at 175.237, has surged by 50 pips due to a robust UK employment report, strengthening the likelihood of a hawkish BoE outlook. The opinion of @nehcap is that there will be more growth potential.
…
This is a premium post.
[s2If !current_user_can(access_s2member_level4)]Please register for FREE REGISTER to read full post below containing analysis. In case of any error or you think you are not able to read the full post below, please email us at support#nehcap.com [lwa][/s2If] [s2If current_user_can(access_s2member_level1)]
- GBP/JPY jumps 50 pips as strong UK employment report bolsters hawkish BoE bets.
The pair currently trades last at 175.237.
The previous day high was 175.77 while the previous day low was 174.36. The daily 38.2% Fib levels comes at 174.9, expected to provide support. Similarly, the daily 61.8% fib level is at 175.23, expected to provide support.
GBP/JPY reverses the previous day’s pullback from the highest levels since January 2016 with a quick jump to refresh intraday high near 175.20 amid the early hours of Tuesday’s London open. In doing so, the cross-currency pair justifies a strong UK employment report, as well as a rebound in the US Treasury bond yields.
That said, the GBP/JPY pair jumps nearly 50 pips as the UK Claimant Count Change for May drops -13.6K versus -9.6K expected and 46.7K prior, whereas the ILO Unemployment Rate for three months to April 3.8% compared to 3.9% previous readings and 4.0% market forecasts.
On a different page, the US 10-year and two-year Treasury bond yields bounce off intraday low during a two-day losing streak, mildly offered near 3.74% and 4.57% respectively at the latest.
Technically, the GBP/JPY pair bounces off the 100-Hour Moving Average (HMA) following the upbeat UK data. The recovery from the key HMA also takes clues from the bullish MACD signals and upbeat RSI (14) line to keep the buyers on board.
However, an upward-sloping resistance line from May 28, close to 175.70 by the press time, can challenge the GBP/JPY bulls as the RSI (14) line approaches the overbought territory.
On the flip side, a clear break of the 100-HMA, around 174.55 as we write, isn’t an open welcome to the GBP/JPY bears as the 61.8% Fibonacci retracement level of its May 31 to June 12 upside, near 173.65, prod the pair’s further downside.
Even if the quote breaks the 173.65 Fibonacci retracement support, the monthly low near 172.65 and the October 2022 peak of around 172.15 can restrict the quote’s south-run.
Trend: Further upside expected
Technical Levels: Supports and Resistances
GBPJPY currently trading at 175.23 at the time of writing. Pair opened at 174.64 and is trading with a change of 0.34% % .
| Overview | Overview.1 | |
|---|---|---|
| 0 | Today last price | 175.23 |
| 1 | Today Daily Change | 0.59 |
| 2 | Today Daily Change % | 0.34% |
| 3 | Today daily open | 174.64 |
The pair remains strongly bullish on the daily timeframe. It trades above its 20 SMA @ 173.17, 50 SMA 169.84, 100 SMA @ 165.69 and 200 SMA @ 164.85.
| Trends | Trends.1 | |
|---|---|---|
| 0 | Daily SMA20 | 173.17 |
| 1 | Daily SMA50 | 169.84 |
| 2 | Daily SMA100 | 165.69 |
| 3 | Daily SMA200 | 164.85 |
The previous day high was 175.77 while the previous day low was 174.36. The daily 38.2% Fib levels comes at 174.9, expected to provide support. Similarly, the daily 61.8% fib level is at 175.23, expected to provide support.
Note the levels of interest below:
- Pivot support is noted at 174.07, 173.51, 172.66
- Pivot resistance is noted at 175.49, 176.33, 176.9
| Levels | Levels.1 |
|---|---|
| Previous Daily High | 175.77 |
| Previous Daily Low | 174.36 |
| Previous Weekly High | 175.54 |
| Previous Weekly Low | 172.67 |
| Previous Monthly High | 174.28 |
| Previous Monthly Low | 167.84 |
| Daily Fibonacci 38.2% | 174.90 |
| Daily Fibonacci 61.8% | 175.23 |
| Daily Pivot Point S1 | 174.07 |
| Daily Pivot Point S2 | 173.51 |
| Daily Pivot Point S3 | 172.66 |
| Daily Pivot Point R1 | 175.49 |
| Daily Pivot Point R2 | 176.33 |
| Daily Pivot Point R3 | 176.90 |
[/s2If]
Nehcap Expert Advisor
The NEHCAP MT4 EA is high quality professional trading system geared to generate returns without using GRID or martingales. Each trade has strict risk per trade parameter. The pairs under management include EURUSD, GBPUSD, AUDCAD, AUDNZD,GBPAUD, EURAUD, EURCAD, CHFJPY and many more.
The system is trading live: LIVE ACCOUNT TRACKING
You can run it free. Apply for a free trial and track our account. Buy the system or use profit share mechanism to generate returns on your MT4.
Join Our Telegram Group
")


