At the price of 0.90633 for USDCHF, the selling orders are placed to lower the intra-day low, ending the two-day consecutive rise. The viewpoint of @nehcap is that the decrease in value will be minimal.
…
This is a premium post.
[s2If !current_user_can(access_s2member_level4)]Please register for FREE REGISTER to read full post below containing analysis. In case of any error or you think you are not able to read the full post below, please email us at support#nehcap.com [lwa][/s2If] [s2If current_user_can(access_s2member_level1)]
- USD/CHF takes offers to refresh intraday low, snaps two-day winning streak.
The pair currently trades last at 0.90633.
The previous day high was 0.9109 while the previous day low was 0.9016. The daily 38.2% Fib levels comes at 0.9074, expected to provide resistance. Similarly, the daily 61.8% fib level is at 0.9051, expected to provide support.
USD/CHF stands on slippery grounds as it drops to 0.9060 heading into Tuesday’s European session. In doing so, the Swiss Franc (CHF) pair prints the first daily loss in three while breaking the 200-Hour Moving Average (HMA) support.
Adding strength to the downside bias are the bearish MACD signals, as well as the RSI (14) reversal from the overbought territory. However, the RSI line’s current place is below the 50.0 level and suggests limited downside room for the USD/CHF pair.
With this, a convergence of the 50-HMA and an ascending trend line from the last Friday, around 0.9045 at the latest, gains the market’s attention as the key downside support.
Should the bears manage to break the stated strong support, a quick slump to the 0.9000 psychological magnet can’t be ruled out. However, the monthly low of 0.8985 and the previous monthly low of 0.8820 can challenge the USD/CHF pair sellers afterward.
Meanwhile, USD/CHF recovery needs to portray a successful trading beyond the 200-HMA level of 0.9065 at the latest.
Also acting as the short-term upside hurdle is the 61.8% Fibonacci retracement of the pair’s downturn from May 31 to June 09, near 0.9085.
Above all, the double top formation around 0.9110 appears crucial resistance for the USD/CHF bulls to cross to retake control.
Trend: Limited downside expected
Technical Levels: Supports and Resistances
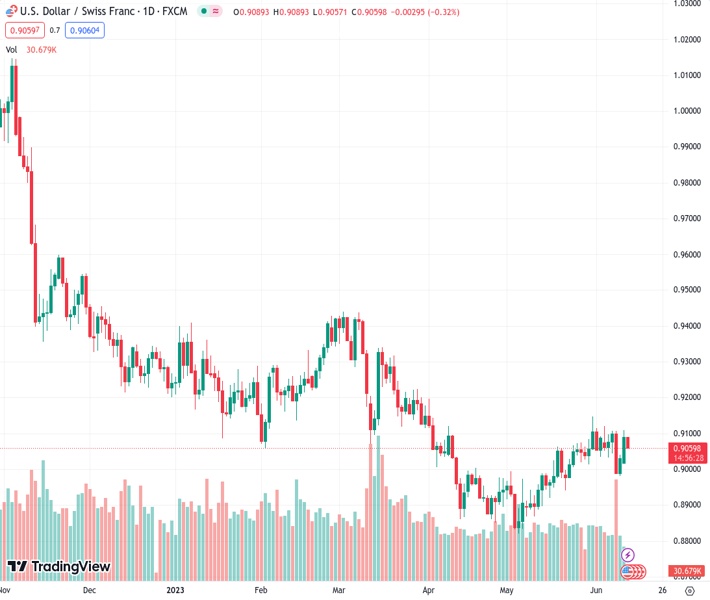
USDCHF currently trading at 0.9061 at the time of writing. Pair opened at 0.909 and is trading with a change of -0.32% % .
| Overview | Overview.1 | |
|---|---|---|
| 0 | Today last price | 0.9061 |
| 1 | Today Daily Change | -0.0029 |
| 2 | Today Daily Change % | -0.32% |
| 3 | Today daily open | 0.909 |
The pair is trading above its 20 Daily moving average @ 0.9043, above its 50 Daily moving average @ 0.8989 , below its 100 Daily moving average @ 0.9118 and below its 200 Daily moving average @ 0.9354
| Trends | Trends.1 | |
|---|---|---|
| 0 | Daily SMA20 | 0.9043 |
| 1 | Daily SMA50 | 0.8989 |
| 2 | Daily SMA100 | 0.9118 |
| 3 | Daily SMA200 | 0.9354 |
The previous day high was 0.9109 while the previous day low was 0.9016. The daily 38.2% Fib levels comes at 0.9074, expected to provide resistance. Similarly, the daily 61.8% fib level is at 0.9051, expected to provide support.
Note the levels of interest below:
- Pivot support is noted at 0.9034, 0.8978, 0.8941
- Pivot resistance is noted at 0.9128, 0.9165, 0.9221
| Levels | Levels.1 |
|---|---|
| Previous Daily High | 0.9109 |
| Previous Daily Low | 0.9016 |
| Previous Weekly High | 0.9120 |
| Previous Weekly Low | 0.8984 |
| Previous Monthly High | 0.9148 |
| Previous Monthly Low | 0.8820 |
| Daily Fibonacci 38.2% | 0.9074 |
| Daily Fibonacci 61.8% | 0.9051 |
| Daily Pivot Point S1 | 0.9034 |
| Daily Pivot Point S2 | 0.8978 |
| Daily Pivot Point S3 | 0.8941 |
| Daily Pivot Point R1 | 0.9128 |
| Daily Pivot Point R2 | 0.9165 |
| Daily Pivot Point R3 | 0.9221 |
[/s2If]
Nehcap Expert Advisor
The NEHCAP MT4 EA is high quality professional trading system geared to generate returns without using GRID or martingales. Each trade has strict risk per trade parameter. The pairs under management include EURUSD, GBPUSD, AUDCAD, AUDNZD,GBPAUD, EURAUD, EURCAD, CHFJPY and many more.
The system is trading live: LIVE ACCOUNT TRACKING
You can run it free. Apply for a free trial and track our account. Buy the system or use profit share mechanism to generate returns on your MT4.
Join Our Telegram Group
")


