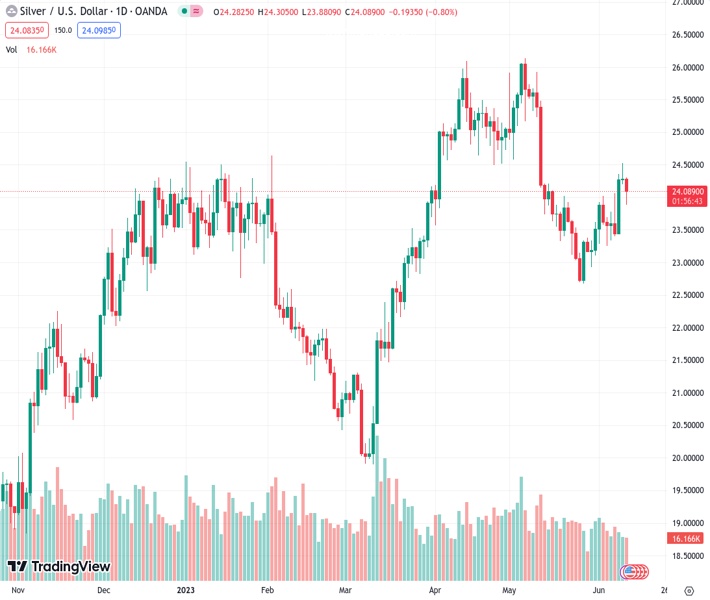
The XAGUSD is currently at 24.083 and experiences a 1.13% decrease to reach $24.00. However, it is being upheld by the 50-day and 20-day EMA.
…
This is a premium post.
[s2If !current_user_can(access_s2member_level4)]Please register for FREE REGISTER to read full post below containing analysis. In case of any error or you think you are not able to read the full post below, please email us at support#nehcap.com [lwa][/s2If] [s2If current_user_can(access_s2member_level1)]
- XAG/USD dips 1.13% to $24.00, supported by 50-day and 20-day EMA.
The pair currently trades last at 24.083.
The previous day high was 24.53 while the previous day low was 24.2. The daily 38.2% Fib levels comes at 24.4, expected to provide resistance. Similarly, the daily 61.8% fib level is at 24.32, expected to provide resistance.
Silver price retreats as it forms a three-candlestick pattern “evening-star” at around $24.00, though cushioned by the presence of the 50-day Exponential Moving Average (EMA) at $23.89, ahead of the 20-day EMA at $23.83. At the time of writing, the XAG/USD is trading at $24.00, below its opening price by 1.13%.
From a daily chart perspective, the XAG/USD is neutral to downward tilted, as the pair remained well below the May 11 high of $25.47. Even though support levels lie at around the $23.83/89 area, the Relative Strength Index (RSI) indicator aims downward, warranting further downside. The three-day Rate of Change (RoC) also portrays buying pressure waning. That said, the XAG/USD pullback could extend further.
The XAG/USD next support would be the 100-day EMA at $23.51, followed by June 8 daily low at $23.41, ahead of testing the 200-day EMA at $22.91. Conversely, the XAG/USD first resistance would be June 9 at $24.52, followed by the $25.00 figure.
Technical Levels: Supports and Resistances
XAGUSD currently trading at 24.03 at the time of writing. Pair opened at 24.29 and is trading with a change of -1.07 % .
| Overview | Overview.1 | |
|---|---|---|
| 0 | Today last price | 24.03 |
| 1 | Today Daily Change | -0.26 |
| 2 | Today Daily Change % | -1.07 |
| 3 | Today daily open | 24.29 |
The pair is trading above its 20 Daily moving average @ 23.58, below its 50 Daily moving average @ 24.49 , above its 100 Daily moving average @ 23.35 and above its 200 Daily moving average @ 22.26
| Trends | Trends.1 | |
|---|---|---|
| 0 | Daily SMA20 | 23.58 |
| 1 | Daily SMA50 | 24.49 |
| 2 | Daily SMA100 | 23.35 |
| 3 | Daily SMA200 | 22.26 |
The previous day high was 24.53 while the previous day low was 24.2. The daily 38.2% Fib levels comes at 24.4, expected to provide resistance. Similarly, the daily 61.8% fib level is at 24.32, expected to provide resistance.
Note the levels of interest below:
- Pivot support is noted at 24.15, 24.01, 23.82
- Pivot resistance is noted at 24.48, 24.67, 24.81
| Levels | Levels.1 |
|---|---|
| Previous Daily High | 24.53 |
| Previous Daily Low | 24.20 |
| Previous Weekly High | 24.53 |
| Previous Weekly Low | 23.25 |
| Previous Monthly High | 26.14 |
| Previous Monthly Low | 22.68 |
| Daily Fibonacci 38.2% | 24.40 |
| Daily Fibonacci 61.8% | 24.32 |
| Daily Pivot Point S1 | 24.15 |
| Daily Pivot Point S2 | 24.01 |
| Daily Pivot Point S3 | 23.82 |
| Daily Pivot Point R1 | 24.48 |
| Daily Pivot Point R2 | 24.67 |
| Daily Pivot Point R3 | 24.81 |
[/s2If]
Nehcap Expert Advisor
The NEHCAP MT4 EA is high quality professional trading system geared to generate returns without using GRID or martingales. Each trade has strict risk per trade parameter. The pairs under management include EURUSD, GBPUSD, AUDCAD, AUDNZD,GBPAUD, EURAUD, EURCAD, CHFJPY and many more.
The system is trading live: LIVE ACCOUNT TRACKING
You can run it free. Apply for a free trial and track our account. Buy the system or use profit share mechanism to generate returns on your MT4.
Join Our Telegram Group
")


