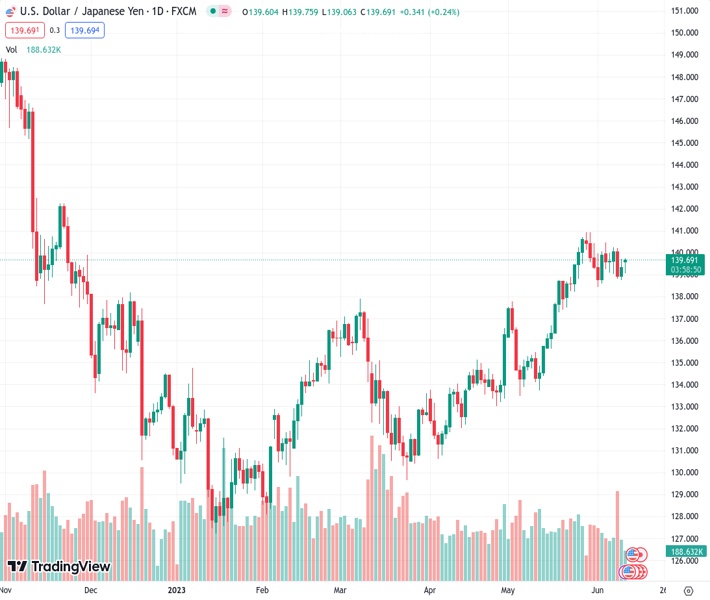
The USDJPY currency pair is at 139.723 and has seen a slight increase of 0.22% due to the impact of increasing US Treasury bond yields.
…
This is a premium post.
[s2If !current_user_can(access_s2member_level4)]Please register for FREE REGISTER to read full post below containing analysis. In case of any error or you think you are not able to read the full post below, please email us at support#nehcap.com [lwa][/s2If] [s2If current_user_can(access_s2member_level1)]
- USD/JPY experiences a modest gain of 0.22%, influenced by rising US Treasury bond yields.
The pair currently trades last at 139.723.
The previous day high was 139.72 while the previous day low was 138.76. The daily 38.2% Fib levels comes at 139.36, expected to provide support. Similarly, the daily 61.8% fib level is at 139.13, expected to provide support.
USD/JPY turned positive at the beginning of the week, lifted by higher US Treasury bond yields as investors prepared for the US Federal Reserve (Fed) monetary policy decision, followed by the Bank of Japan (BoJ). The USD/JPY is trading at 139.65, printing modest gains of 0.22% after hitting a daily low of 139.06.
US equities portray an upbeat market sentiment, despite rising US bond yields. The 10-year benchmark note rate sits at 3.778%, up three and a half basis points (bps), a tailwind for the USD/JPY. The greenback is recovering lost ground, climbing 0.16%, per the US Dollar Index (DXY), at 103.722, shy of reclaiming the 104.000 figure.
Fundamentally speaking, an absent US economic docket keeps investors focused on the last week’s data. The Non-Manufacturing ISM, although at expansionary territory, dipped close to 50, suggesting an ongoing economic slowdown. That, alongside Initial Jobless Claims (IJC) rising above estimates, hitting its highest figures since October 2021, justified the Fed’s need to pause its tightening cycle and wait for upcoming data.
On the Japanese front, the latest data revealed the Producer Price Index (PPI) for May, climbed 5.1% YoY, below estimates of 5.6%, while month-over-month figures showed a plunge of -0.7%, compared to April’s 0.3% gain. Annual-based PPI hit its slowest since July 2021 after hitting 5.9% in April.
On Tuesday, the US economic docket will feature May’s Consumer Price Index (CPI), the NFIB Business Optimism Index, followed by Wednesday’s Fed decision. On the Japanese front, the calendar will feature the Balance of Trade ahead of the Bank of Japan’s (BoJ) monetary policy meeting.
The USD/JPY is neutrally biased after failing to crack below/above the boundaries of a 200-pip range at around 138.40/140.45. However, from a medium-term view, with the daily Exponential Moving Averages (EMAs) positioned below the spot price, the pair is upward, but it needs to crack the top of the range, so the USD/JPY can test the year-to-date (YTD) high of 140.92. In the case of being broken, the USD/JPY next stop is 141.00, ahead of the November 22 high at 142.24. Conversely, a drop below the 20-day EMA at 138.79 will expose the bottom of the range at 138.40, ahead of 138.00.
Technical Levels: Supports and Resistances
USDJPY currently trading at 139.69 at the time of writing. Pair opened at 139.39 and is trading with a change of 0.22 % .
| Overview | Overview.1 | |
|---|---|---|
| 0 | Today last price | 139.69 |
| 1 | Today Daily Change | 0.30 |
| 2 | Today Daily Change % | 0.22 |
| 3 | Today daily open | 139.39 |
The pair remains strongly bullish on the daily timeframe. It trades above its 20 SMA @ 139.01, 50 SMA 136.05, 100 SMA @ 134.5 and 200 SMA @ 137.3.
| Trends | Trends.1 | |
|---|---|---|
| 0 | Daily SMA20 | 139.01 |
| 1 | Daily SMA50 | 136.05 |
| 2 | Daily SMA100 | 134.50 |
| 3 | Daily SMA200 | 137.30 |
The previous day high was 139.72 while the previous day low was 138.76. The daily 38.2% Fib levels comes at 139.36, expected to provide support. Similarly, the daily 61.8% fib level is at 139.13, expected to provide support.
Note the levels of interest below:
- Pivot support is noted at 138.86, 138.32, 137.89
- Pivot resistance is noted at 139.82, 140.26, 140.79
| Levels | Levels.1 |
|---|---|
| Previous Daily High | 139.72 |
| Previous Daily Low | 138.76 |
| Previous Weekly High | 140.45 |
| Previous Weekly Low | 138.76 |
| Previous Monthly High | 140.93 |
| Previous Monthly Low | 133.50 |
| Daily Fibonacci 38.2% | 139.36 |
| Daily Fibonacci 61.8% | 139.13 |
| Daily Pivot Point S1 | 138.86 |
| Daily Pivot Point S2 | 138.32 |
| Daily Pivot Point S3 | 137.89 |
| Daily Pivot Point R1 | 139.82 |
| Daily Pivot Point R2 | 140.26 |
| Daily Pivot Point R3 | 140.79 |
[/s2If]
Nehcap Expert Advisor
The NEHCAP MT4 EA is high quality professional trading system geared to generate returns without using GRID or martingales. Each trade has strict risk per trade parameter. The pairs under management include EURUSD, GBPUSD, AUDCAD, AUDNZD,GBPAUD, EURAUD, EURCAD, CHFJPY and many more.
The system is trading live: LIVE ACCOUNT TRACKING
You can run it free. Apply for a free trial and track our account. Buy the system or use profit share mechanism to generate returns on your MT4.
Join Our Telegram Group
")


