The USDCAD is facing difficulty around its two-month low even though it has recorded its first daily increase in five. Nehcap believes that there will be more decline to come.
…
This is a premium post.
[s2If !current_user_can(access_s2member_level4)]Please register for FREE REGISTER to read full post below containing analysis. In case of any error or you think you are not able to read the full post below, please email us at support#nehcap.com [lwa][/s2If] [s2If current_user_can(access_s2member_level1)]
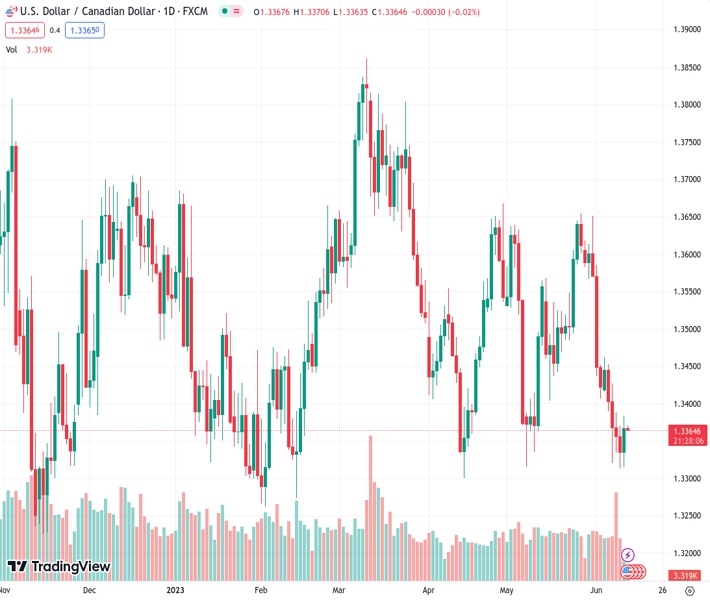
- USD/CAD struggles near two-month low after posting the first daily gain in five.
The pair currently trades last at 1.33656.
The previous day high was 1.3371 while the previous day low was 1.3313. The daily 38.2% Fib levels comes at 1.3335, expected to provide support. Similarly, the daily 61.8% fib level is at 1.3349, expected to provide support.
USD/CAD retreats from 1.3383, sidelined near 1.3365 amid early hours of Tuesday’s Asian session. In doing so, the Loonie pair fails to defend the previous day’s corrective bounce off a seven-month-old ascending support line while staying near the lowest levels in two months.
That said, the below 50.0 levels of the RSI (14) line joins an upward-sloping support line from the mid-November 2022 to restrict short-term downside of the USD/CAD pair around 1.3330.
However, the bearish MACD signals and the Loonie pair’s sustained trading below the 200-day Exponential Moving Average (EMA), close to 1.3410 by the press time, keeps the sellers hopeful.
Adding strength to the 200-EMA hurdle is the 10-EMA level surrounding 1.3420, which in turn highlights the 1.3410-20 as the short-term upside limit for the USD/CAD pair.
Should the quote manage to cross the 1.3420 resistance, the previous weekly high of around 1.3460 can act as an extra filter towards the north before welcoming the USD/CAD buyers.
On the flip side, a daily closing below the aforementioned key support line, around 1.3330 at the latest, can quickly fetch the USD/CAD price towards the yearly low of 1.3262. However, the bottoms marked in May and April, respectively near 1.3315 and 1.3300 will challenge the Loonie bears.
It should be noted that the November 2022 low of near 1.3226 can act as the extra downside filter for the Loonie pair bears to watch before taking control.
Trend: Further downside expected
Technical Levels: Supports and Resistances
USDCAD currently trading at 1.3365 at the time of writing. Pair opened at 1.3338 and is trading with a change of 0.20% % .
| Overview | Overview.1 | |
|---|---|---|
| 0 | Today last price | 1.3365 |
| 1 | Today Daily Change | 0.0027 |
| 2 | Today Daily Change % | 0.20% |
| 3 | Today daily open | 1.3338 |
The pair remains strongly bearish on the daily time frame. It trades below the 20 SMA @ 1.3492, 50 SMA 1.3488, 100 SMA @ 1.3515 and 200 SMA @ 1.3514.
| Trends | Trends.1 | |
|---|---|---|
| 0 | Daily SMA20 | 1.3492 |
| 1 | Daily SMA50 | 1.3488 |
| 2 | Daily SMA100 | 1.3515 |
| 3 | Daily SMA200 | 1.3514 |
The previous day high was 1.3371 while the previous day low was 1.3313. The daily 38.2% Fib levels comes at 1.3335, expected to provide support. Similarly, the daily 61.8% fib level is at 1.3349, expected to provide support.
Note the levels of interest below:
- Pivot support is noted at 1.331, 1.3283, 1.3252
- Pivot resistance is noted at 1.3368, 1.3399, 1.3426
| Levels | Levels.1 |
|---|---|
| Previous Daily High | 1.3371 |
| Previous Daily Low | 1.3313 |
| Previous Weekly High | 1.3462 |
| Previous Weekly Low | 1.3313 |
| Previous Monthly High | 1.3655 |
| Previous Monthly Low | 1.3315 |
| Daily Fibonacci 38.2% | 1.3335 |
| Daily Fibonacci 61.8% | 1.3349 |
| Daily Pivot Point S1 | 1.3310 |
| Daily Pivot Point S2 | 1.3283 |
| Daily Pivot Point S3 | 1.3252 |
| Daily Pivot Point R1 | 1.3368 |
| Daily Pivot Point R2 | 1.3399 |
| Daily Pivot Point R3 | 1.3426 |
[/s2If]
Nehcap Expert Advisor
The NEHCAP MT4 EA is high quality professional trading system geared to generate returns without using GRID or martingales. Each trade has strict risk per trade parameter. The pairs under management include EURUSD, GBPUSD, AUDCAD, AUDNZD,GBPAUD, EURAUD, EURCAD, CHFJPY and many more.
The system is trading live: LIVE ACCOUNT TRACKING
You can run it free. Apply for a free trial and track our account. Buy the system or use profit share mechanism to generate returns on your MT4.
Join Our Telegram Group
")


