The GBPUSD currency pair decreased in value and is currently trading at 1.2497, following a failed attempt to go above 1.2600. This decline is attributed to the rising yields of US Treasury bonds.
…
This is a premium post.
[s2If !current_user_can(access_s2member_level4)]Please register for FREE REGISTER to read full post below containing analysis. In case of any error or you think you are not able to read the full post below, please email us at support#nehcap.com [lwa][/s2If] [s2If current_user_can(access_s2member_level1)]
- GBP/USD dips after failing to breach 1.2600, now trading at 1.2497 amid climbing US Treasury bond yields.
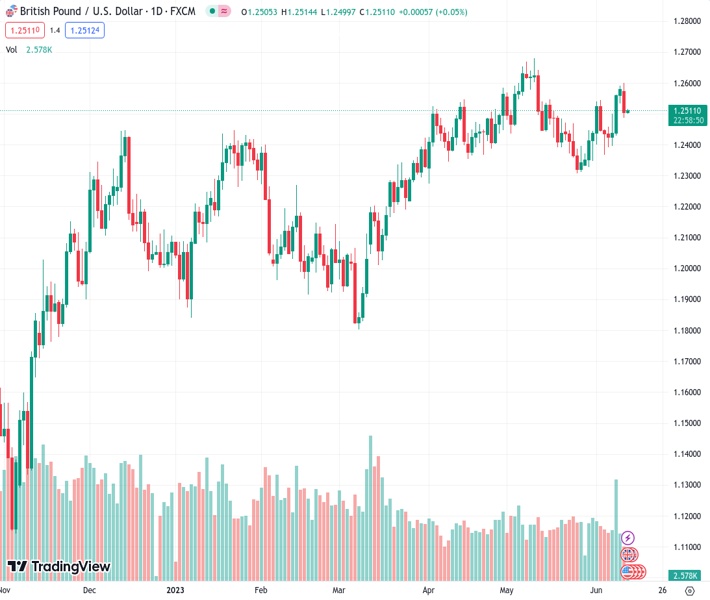
The pair currently trades last at 1.25123.
The previous day high was 1.259 while the previous day low was 1.2534. The daily 38.2% Fib levels comes at 1.2569, expected to provide resistance. Similarly, the daily 61.8% fib level is at 1.2556, expected to provide resistance.
GBP/USD slumps in the North American session after reaching a fresh five-week high at 1.2599 amidst a light economic calendar, which would gain interest since Tuesday. Rising US Treasury bond yields and some US Dollar (USD) strength keep the Sterling (GBP) under downward pressure following the GBP/USD failure to crack 1.2600. At the time of writing, the GBP/USD is trading at 1.2513.
Wall Street continues to trade in a positive direction. At the same time US Treasury bond yields climb, as the 10-year US T-note yields 3.774%, three basis points (bps) up from its opening yield. Consequently, the DXY is printing modest gains of 0.15% at 103.706.
Given the lack of economic data revealed on Monday, GBP/USD traders lean onto the last week’s US data. The ISM revealed its Services PMI, which expanded but is dangerously edging towards the 50 lines, seen as an expansionary/recessionary level, suggesting the economy continues to deteriorate. That, alongside the jump in unemployment claims for the week ending June 2, justified the US Federal Reserve (Fed) stance to pause rate increases.
Aside from this, a parade of Bank of England (BoE) policymakers crossed newswires, led by Jonathan Haskel, who said the BoE “may need to raise rates more than once, from the current 4.5% level to control inflation.
Echoing some of his comments, Catherine Mann said that inflation expectations remain high, but the latest drop was important to shift her stance from a 50 to a 25 bps hike in the latest meeting. She said service inflation and wage price increases are a concern “for achieving the 2% CPI target.” Mann added, “Monetary policy is not good at fine-tuning, should focus on inflation.”
On Tuesday, the US economic docket will feature May’s Consumer Price Index (CPI), the NFIB Business Optimism Index, followed by Wednesday’s Fed decision. On the UK front, employment figures will be featured on Tuesday, ahead of growth figures on Wednesday.
From a technical perspective, the GBP/USD is upward biased, trending well above the Exponential Moving Averages (EMAs) on the daily chart. Still, the pullback could put at risk support at the 20-day EMA at 1.2466. If GBP/USD falls below 1.2500, that could put the latter in the sellers’ eyesight, followed by dynamic support at the 50-day EMA at 1.2426. A break below will expose the 1.2400 figure. Conversely, the GBP/USD first resistance would be the 1.2600 mark, followed by the year-to-date (YTD) high of 1.2680.
Technical Levels: Supports and Resistances
GBPUSD currently trading at 1.2511 at the time of writing. Pair opened at 1.258 and is trading with a change of -0.55 % .
| Overview | Overview.1 | |
|---|---|---|
| 0 | Today last price | 1.2511 |
| 1 | Today Daily Change | -0.0069 |
| 2 | Today Daily Change % | -0.5500 |
| 3 | Today daily open | 1.2580 |
The pair remains strongly bullish on the daily timeframe. It trades above its 20 SMA @ 1.2443, 50 SMA 1.2469, 100 SMA @ 1.2309 and 200 SMA @ 1.2016.
| Trends | Trends.1 | |
|---|---|---|
| 0 | Daily SMA20 | 1.2443 |
| 1 | Daily SMA50 | 1.2469 |
| 2 | Daily SMA100 | 1.2309 |
| 3 | Daily SMA200 | 1.2016 |
The previous day high was 1.259 while the previous day low was 1.2534. The daily 38.2% Fib levels comes at 1.2569, expected to provide resistance. Similarly, the daily 61.8% fib level is at 1.2556, expected to provide resistance.
Note the levels of interest below:
- Pivot support is noted at 1.2546, 1.2512, 1.249
- Pivot resistance is noted at 1.2602, 1.2624, 1.2658
| Levels | Levels.1 |
|---|---|
| Previous Daily High | 1.2590 |
| Previous Daily Low | 1.2534 |
| Previous Weekly High | 1.2590 |
| Previous Weekly Low | 1.2369 |
| Previous Monthly High | 1.2680 |
| Previous Monthly Low | 1.2308 |
| Daily Fibonacci 38.2% | 1.2569 |
| Daily Fibonacci 61.8% | 1.2556 |
| Daily Pivot Point S1 | 1.2546 |
| Daily Pivot Point S2 | 1.2512 |
| Daily Pivot Point S3 | 1.2490 |
| Daily Pivot Point R1 | 1.2602 |
| Daily Pivot Point R2 | 1.2624 |
| Daily Pivot Point R3 | 1.2658 |
[/s2If]
Nehcap Expert Advisor
The NEHCAP MT4 EA is high quality professional trading system geared to generate returns without using GRID or martingales. Each trade has strict risk per trade parameter. The pairs under management include EURUSD, GBPUSD, AUDCAD, AUDNZD,GBPAUD, EURAUD, EURCAD, CHFJPY and many more.
The system is trading live: LIVE ACCOUNT TRACKING
You can run it free. Apply for a free trial and track our account. Buy the system or use profit share mechanism to generate returns on your MT4.
Join Our Telegram Group
")


