The currency pair NZDUSD at a rate of 0.61107 experienced a slight drop to approximately 0.6150 as a result of an apparent improvement in the USD Index.
…
This is a premium post.
[s2If !current_user_can(access_s2member_level4)]Please register for FREE REGISTER to read full post below containing analysis. In case of any error or you think you are not able to read the full post below, please email us at support#nehcap.com [lwa][/s2If] [s2If current_user_can(access_s2member_level1)]
- NZD/USD has witnessed a minor decline around 0.6150 due to a decent recovery in the USD Index.
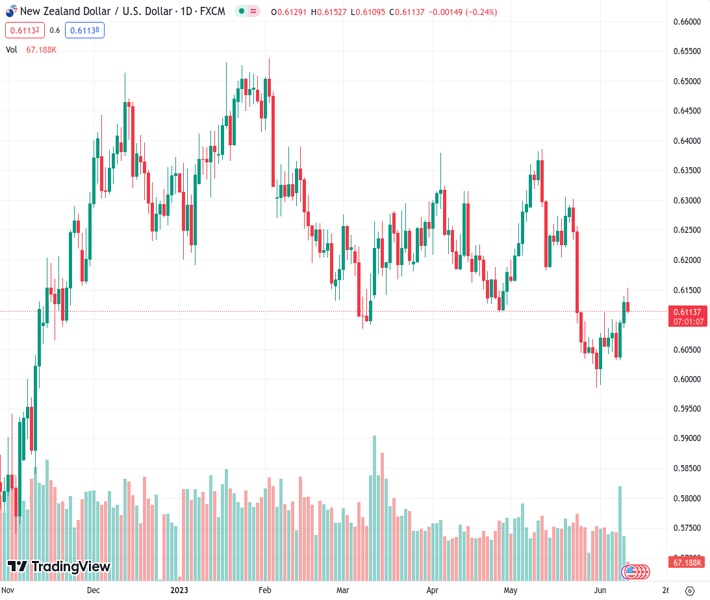
The pair currently trades last at 0.61107.
The previous day high was 0.6143 while the previous day low was 0.6084. The daily 38.2% Fib levels comes at 0.6121, expected to provide resistance. Similarly, the daily 61.8% fib level is at 0.6107, expected to provide support.
The NZD/USD pair has witnessed a halt in the upside momentum around 0.6150 in the European session. The Kiwi asset has faced delicate barriers as the US Dollar Index (DXY) has attempted a solid recovery. Sheer volatility in the US Dollar Index is highly expected as investors are turning anxious ahead of the United States inflation and the interest rate decision by the Federal Reserve (Fed).
The USD Index has shown a solid rebound after testing territory below 103.30 as the street is mixed about the interest rate policy. Investors will keep focus on the US Consumer Price Index (CPI) data and further persistence in core inflation could accelerate the odds of one more interest rate hike from the Fed.
On the New Zealand Dollar front, Q1 Gross Domestic Product (GDP) will remain in the spotlight. Quarterly GDP is seen contracting by 0.1% against a prior contraction of 0.6%. On an annualized basis, the economic data is expected to expand by 2.6%, higher than the prior contraction of 2.2%.
NZD/USD has climbed above the horizontal resistance plotted from April 26 low at 0.6111, which has turned into a cushion for the Kiwi bulls. The downward-sloping trendline plotted from May 11 high at 0.6385 is acting as a barricade of the New Zealand Dollar.
Also, the 200-Exponential Moving Average (EMA) at 0.6147 is restricting the New Zealand Dollar from any upside move.
The Relative Strength Index (RSI) (14) has shifted into the bullish range of 60.00-80.00, which indicates that upside momentum has been triggered.
A confident break above May 01 low at 0.6160 will drive the Kiwi asset toward the round-level resistance at 0.6200 followed by May 17 high at 0.6261.
Alternatively, a downside move below the intraday low at 0.6015 will expose the asset for a fresh six-month low toward 11 November 2022 low at 0.5984. A slippage below the latter would expose the asset toward 02 November 2022 high at 0.5941.
Technical Levels: Supports and Resistances
NZDUSD currently trading at 0.6136 at the time of writing. Pair opened at 0.6143 and is trading with a change of -0.11 % .
| Overview | Overview.1 | |
|---|---|---|
| 0 | Today last price | 0.6136 |
| 1 | Today Daily Change | -0.0007 |
| 2 | Today Daily Change % | -0.1100 |
| 3 | Today daily open | 0.6143 |
The pair is trading above its 20 Daily moving average @ 0.6125, below its 50 Daily moving average @ 0.6188 , below its 100 Daily moving average @ 0.6234 and below its 200 Daily moving average @ 0.6149
| Trends | Trends.1 | |
|---|---|---|
| 0 | Daily SMA20 | 0.6125 |
| 1 | Daily SMA50 | 0.6188 |
| 2 | Daily SMA100 | 0.6234 |
| 3 | Daily SMA200 | 0.6149 |
The previous day high was 0.6143 while the previous day low was 0.6084. The daily 38.2% Fib levels comes at 0.6121, expected to provide resistance. Similarly, the daily 61.8% fib level is at 0.6107, expected to provide support.
Note the levels of interest below:
- Pivot support is noted at 0.6103, 0.6064, 0.6044
- Pivot resistance is noted at 0.6163, 0.6183, 0.6222
| Levels | Levels.1 |
|---|---|
| Previous Daily High | 0.6143 |
| Previous Daily Low | 0.6084 |
| Previous Weekly High | 0.6143 |
| Previous Weekly Low | 0.6026 |
| Previous Monthly High | 0.6385 |
| Previous Monthly Low | 0.5985 |
| Daily Fibonacci 38.2% | 0.6121 |
| Daily Fibonacci 61.8% | 0.6107 |
| Daily Pivot Point S1 | 0.6103 |
| Daily Pivot Point S2 | 0.6064 |
| Daily Pivot Point S3 | 0.6044 |
| Daily Pivot Point R1 | 0.6163 |
| Daily Pivot Point R2 | 0.6183 |
| Daily Pivot Point R3 | 0.6222 |
[/s2If]
Nehcap Expert Advisor
The NEHCAP MT4 EA is high quality professional trading system geared to generate returns without using GRID or martingales. Each trade has strict risk per trade parameter. The pairs under management include EURUSD, GBPUSD, AUDCAD, AUDNZD,GBPAUD, EURAUD, EURCAD, CHFJPY and many more.
The system is trading live: LIVE ACCOUNT TRACKING
You can run it free. Apply for a free trial and track our account. Buy the system or use profit share mechanism to generate returns on your MT4.
Join Our Telegram Group
")


