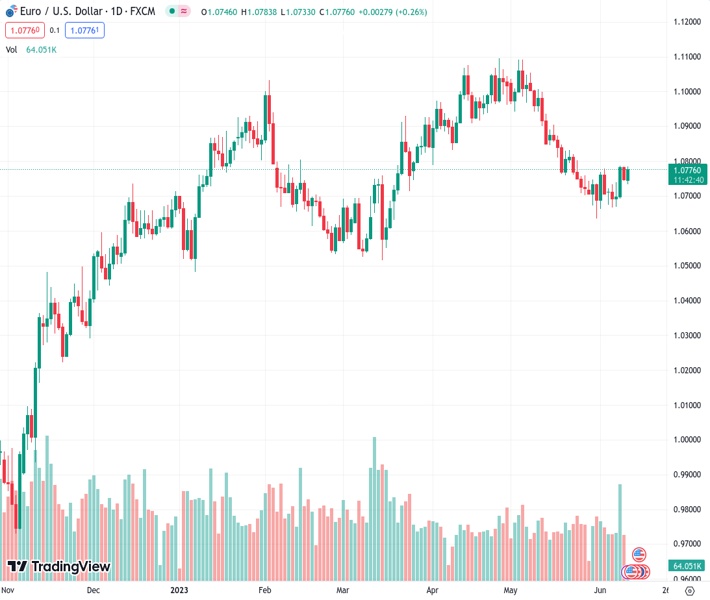
#EURUSD @ 1.07760 has shown a perpendicular recovery to near 1.0784 as investors have underpinned the risk appetite theme. (Pivot Orderbook analysis)
…
This is a premium post.
[s2If !current_user_can(access_s2member_level4)]Please register for FREE REGISTER to read full post below containing analysis. In case of any error or you think you are not able to read the full post below, please email us at support#nehcap.com [lwa][/s2If] [s2If current_user_can(access_s2member_level1)]
- EUR/USD has shown a perpendicular recovery to near 1.0784 as investors have underpinned the risk appetite theme.
- US headline CPI is seen softening due to lower oil prices while core inflation is expected to remain persistent.
- EUR/USD had strongly rebounded after sensing buying interest near the 61.8% Fibonacci retracement at 1.0738.
The pair currently trades last at 1.07760.
The previous day high was 1.0785 while the previous day low was 1.0743. The daily 38.2% Fib levels comes at 1.0759, expected to provide support. Similarly, the daily 61.8% fib level is at 1.0769, expected to provide support.
The EUR/USD pair has displayed a vertical recovery from 1.0740 in the European session. The major currency pair has shifted into a bullish trajectory as the market mood has turned cheerful on hopes that the Federal Reserve (Fed) could postpone an interest rate hike for July monetary policy meeting.
S&P500 futures have added significant gains in the London session amid a solid appeal for the risk-sensitive assets. Before the Fed’s policy decision, United States inflation data will be keenly watched. Headline Consumer Price Index (CPI) is seen softening due to lower oil prices while core inflation is expected to remain persistent.
Also, investors are awaiting the interest rate decision by the European Central Bank (ECB), which will be announced on Thursday. ECB President Christine Lagarde is expected to raise interest rates further by 25 basis points (bps) to 4%.
EUR/USD had strongly rebounded after sensing buying interest near the 61.8% Fibonacci retracement (plotted from March 15 low at 1.0516 to April 26 high at 1.1095) at 1.0738.
A bull cross, represented by the 20-and 50-period Exponential Moving Averages (EMAs) at 1.0725, adds to the upside filters.
The Relative Strength Index (RSI) (14) is attempting to shift into the bullish range of 60.00-80.00. An occurrence of the same will be followed by an upside momentum.
A confident move above June 08 high at 1.0787 will drive the shared currency pair toward May 22 high at 1.0831, followed by the 38.2% Fibo retracement at 1.0874.
In an alternate scenario, the downside move will resume if the shared currency pair drops below the June 05 low at 1.0675. This will drag the asset towards May 31 low at 1.0635 followed by March 03 low at 1.0588.
Technical Levels: Supports and Resistances
EURUSD currently trading at 1.0777 at the time of writing. Pair opened at 1.0749 and is trading with a change of 0.26 % .
| Overview | Overview.1 | |
|---|---|---|
| 0 | Today last price | 1.0777 |
| 1 | Today Daily Change | 0.0028 |
| 2 | Today Daily Change % | 0.2600 |
| 3 | Today daily open | 1.0749 |
The pair is trading above its 20 Daily moving average @ 1.0759, below its 50 Daily moving average @ 1.0885 , below its 100 Daily moving average @ 1.0808 and above its 200 Daily moving average @ 1.052
| Trends | Trends.1 | |
|---|---|---|
| 0 | Daily SMA20 | 1.0759 |
| 1 | Daily SMA50 | 1.0885 |
| 2 | Daily SMA100 | 1.0808 |
| 3 | Daily SMA200 | 1.0520 |
The previous day high was 1.0785 while the previous day low was 1.0743. The daily 38.2% Fib levels comes at 1.0759, expected to provide support. Similarly, the daily 61.8% fib level is at 1.0769, expected to provide support.
Note the levels of interest below:
- Pivot support is noted at 1.0733, 1.0717, 1.069
- Pivot resistance is noted at 1.0775, 1.0801, 1.0817
| Levels | Levels.1 |
|---|---|
| Previous Daily High | 1.0785 |
| Previous Daily Low | 1.0743 |
| Previous Weekly High | 1.0787 |
| Previous Weekly Low | 1.0667 |
| Previous Monthly High | 1.1092 |
| Previous Monthly Low | 1.0635 |
| Daily Fibonacci 38.2% | 1.0759 |
| Daily Fibonacci 61.8% | 1.0769 |
| Daily Pivot Point S1 | 1.0733 |
| Daily Pivot Point S2 | 1.0717 |
| Daily Pivot Point S3 | 1.0690 |
| Daily Pivot Point R1 | 1.0775 |
| Daily Pivot Point R2 | 1.0801 |
| Daily Pivot Point R3 | 1.0817 |
[/s2If]
Nehcap Expert Advisor
The NEHCAP MT4 EA is high quality professional trading system geared to generate returns without using GRID or martingales. Each trade has strict risk per trade parameter. The pairs under management include EURUSD, GBPUSD, AUDCAD, AUDNZD,GBPAUD, EURAUD, EURCAD, CHFJPY and many more.
The system is trading live: LIVE ACCOUNT TRACKING
You can run it free. Apply for a free trial and track our account. Buy the system or use profit share mechanism to generate returns on your MT4.
Join Our Telegram Group
")


