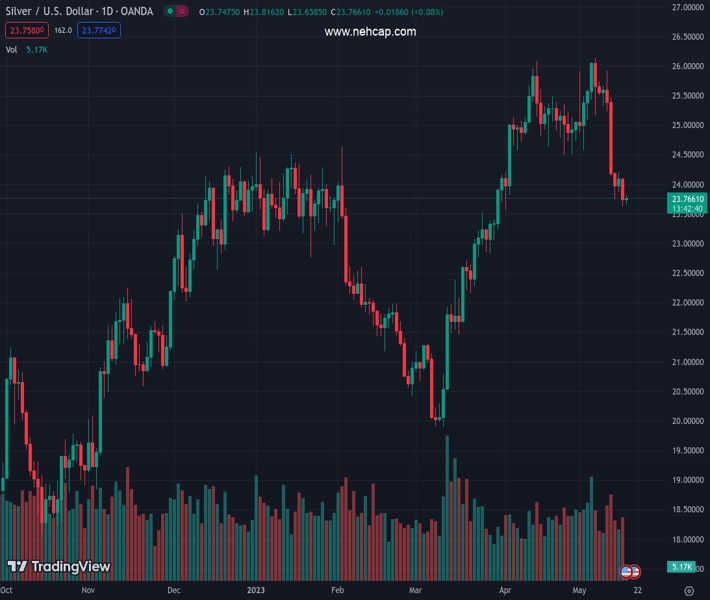
#XAGUSD @ 23.762 Silver consolidates the overnight slide to its lowest level since early April. (Pivot Orderbook analysis)
…
This is a premium post.
[s2If !current_user_can(access_s2member_level4)]Please register for FREE REGISTER to read full post below containing analysis. In case of any error or you think you are not able to read the full post below, please email us at support#nehcap.com [lwa][/s2If] [s2If current_user_can(access_s2member_level1)]
- Silver consolidates the overnight slide to its lowest level since early April.
- The setup favours bearish traders and supports prospects for further losses.
- Any attempted recovery is likely to remain capped near the $24.25-30 area.
The pair currently trades last at 23.762.
The previous day high was 24.11 while the previous day low was 23.64. The daily 38.2% Fib levels comes at 23.82, expected to provide resistance. Similarly, the daily 61.8% fib level is at 23.93, expected to provide resistance.
Silver enters a bearish consolidation phase on Wednesday and oscillates in a narrow trading band around the $23.70-$23.75 area, just above its lowest level since April 3 touched the previous day.
From a technical perspective, the aforementioned area represents the 38.2% Fibonacci retracement level of the March-May rise. Some follow-through selling will expose the 100-day Simple Moving Average (SMA), currently pegged around the $23.40-$23.35 region, below which the XAG/USD could slide towards 50% Fibo. level, around the $23.00 round-figure mark.
Some follow-through selling below the latter will be seen as a fresh trigger for bearish traders and set the stage for an extension of the recent sharp pullback from over a one-year top touched earlier this month. The XAG/USD might then accelerate the fall towards the $22.65-$22.60 intermediate support before dropping to the $22.30-$22.25 zone, or the 61.8% Fibo. level.
Meanwhile, oscillators on the daily chart are holding deep in the negative territory and are still far from being in the oversold zone. Hence, any attempted recovery back above the $24.00 mark is more likely to attract fresh sellers and remain capped near the $24.25-$24.30 supply zone. That said, some follow-through buying might prompt an aggressive short-covering rally.
The XAG/USD might then surpass the 23.6% Fibo. level, around the $24.60 zone, aim to reclaim the $25.00 psychological mark. The momentum could get extended further towards the $25.30-$25.40 supply zone en route to the $26.00 round figure and the YTD peak, around the $26.10-$26.15 region.
Technical Levels: Supports and Resistances
XAGUSD currently trading at 23.73 at the time of writing. Pair opened at 23.76 and is trading with a change of -0.13 % .
| Overview | Overview.1 | |
|---|---|---|
| 0 | Today last price | 23.73 |
| 1 | Today Daily Change | -0.03 |
| 2 | Today Daily Change % | -0.13 |
| 3 | Today daily open | 23.76 |
The pair is trading below its 20 Daily moving average @ 25.05, below its 50 Daily moving average @ 23.98 , above its 100 Daily moving average @ 23.4 and above its 200 Daily moving average @ 21.89
| Trends | Trends.1 | |
|---|---|---|
| 0 | Daily SMA20 | 25.05 |
| 1 | Daily SMA50 | 23.98 |
| 2 | Daily SMA100 | 23.40 |
| 3 | Daily SMA200 | 21.89 |
The previous day high was 24.11 while the previous day low was 23.64. The daily 38.2% Fib levels comes at 23.82, expected to provide resistance. Similarly, the daily 61.8% fib level is at 23.93, expected to provide resistance.
Note the levels of interest below:
- Pivot support is noted at 23.56, 23.36, 23.09
- Pivot resistance is noted at 24.03, 24.3, 24.5
| Levels | Levels.1 |
|---|---|
| Previous Daily High | 24.11 |
| Previous Daily Low | 23.64 |
| Previous Weekly High | 25.92 |
| Previous Weekly Low | 23.74 |
| Previous Monthly High | 26.09 |
| Previous Monthly Low | 23.57 |
| Daily Fibonacci 38.2% | 23.82 |
| Daily Fibonacci 61.8% | 23.93 |
| Daily Pivot Point S1 | 23.56 |
| Daily Pivot Point S2 | 23.36 |
| Daily Pivot Point S3 | 23.09 |
| Daily Pivot Point R1 | 24.03 |
| Daily Pivot Point R2 | 24.30 |
| Daily Pivot Point R3 | 24.50 |
[/s2If]
Nehcap Expert Advisor
The NEHCAP MT4 EA is high quality professional trading system geared to generate returns without using GRID or martingales. Each trade has strict risk per trade parameter. The pairs under management include EURUSD, GBPUSD, AUDCAD, AUDNZD,GBPAUD, EURAUD, EURCAD, CHFJPY and many more.
The system is trading live: LIVE ACCOUNT TRACKING
You can run it free. Apply for a free trial and track our account. Buy the system or use profit share mechanism to generate returns on your MT4.
Join Our Telegram Group
")


